
FAQ
-
What is Tableau?
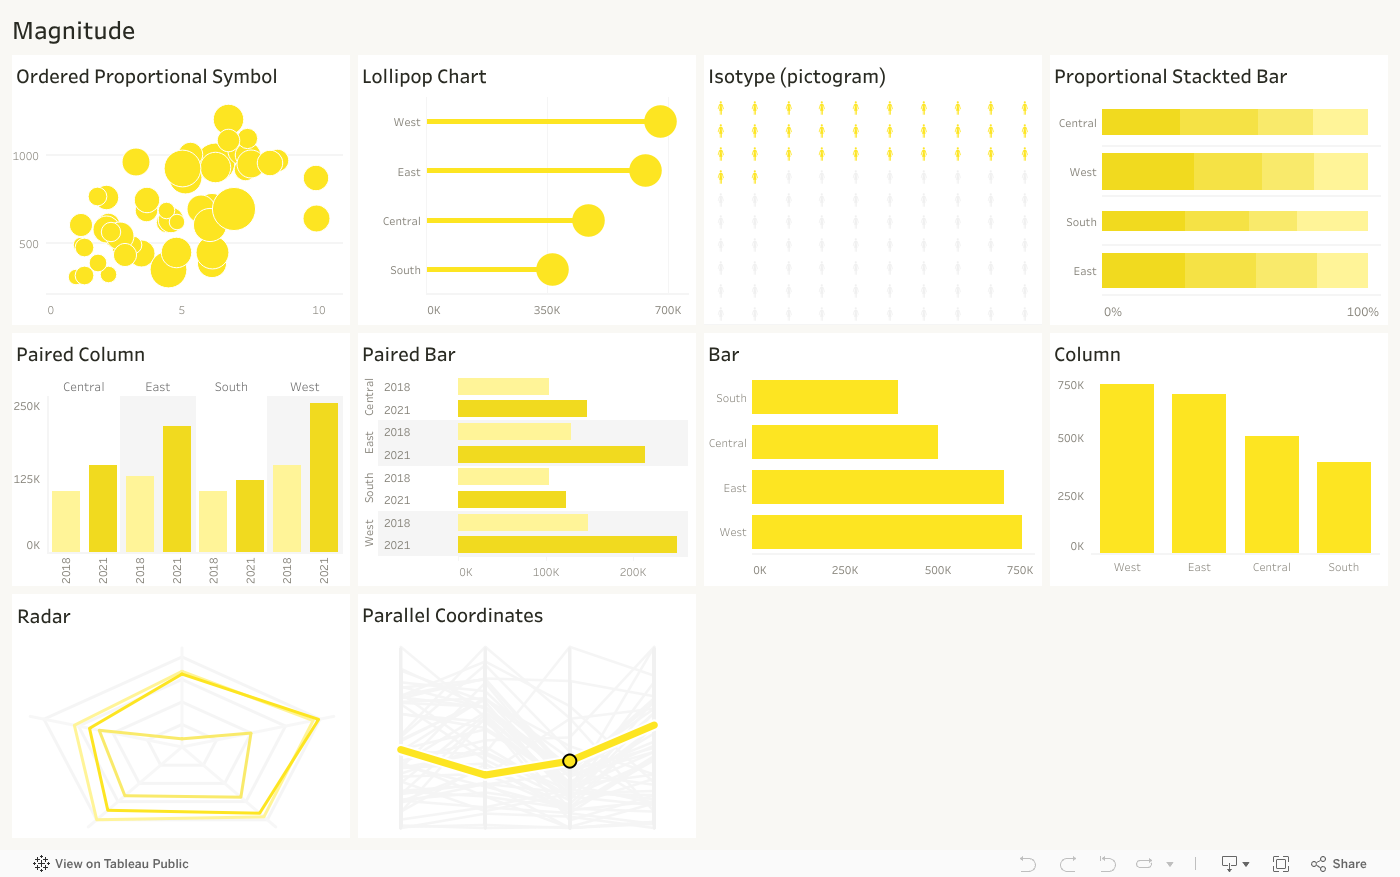
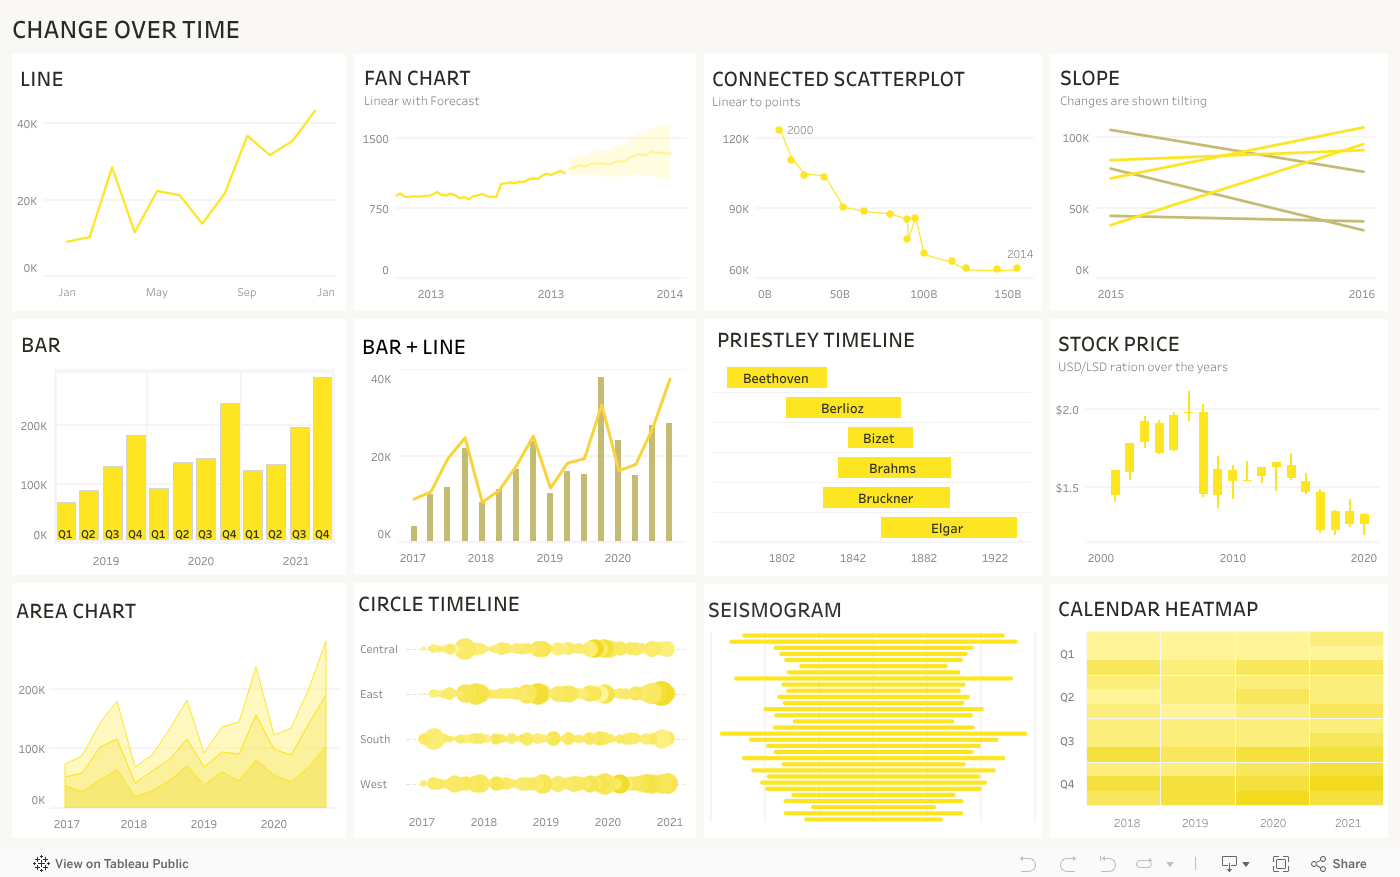
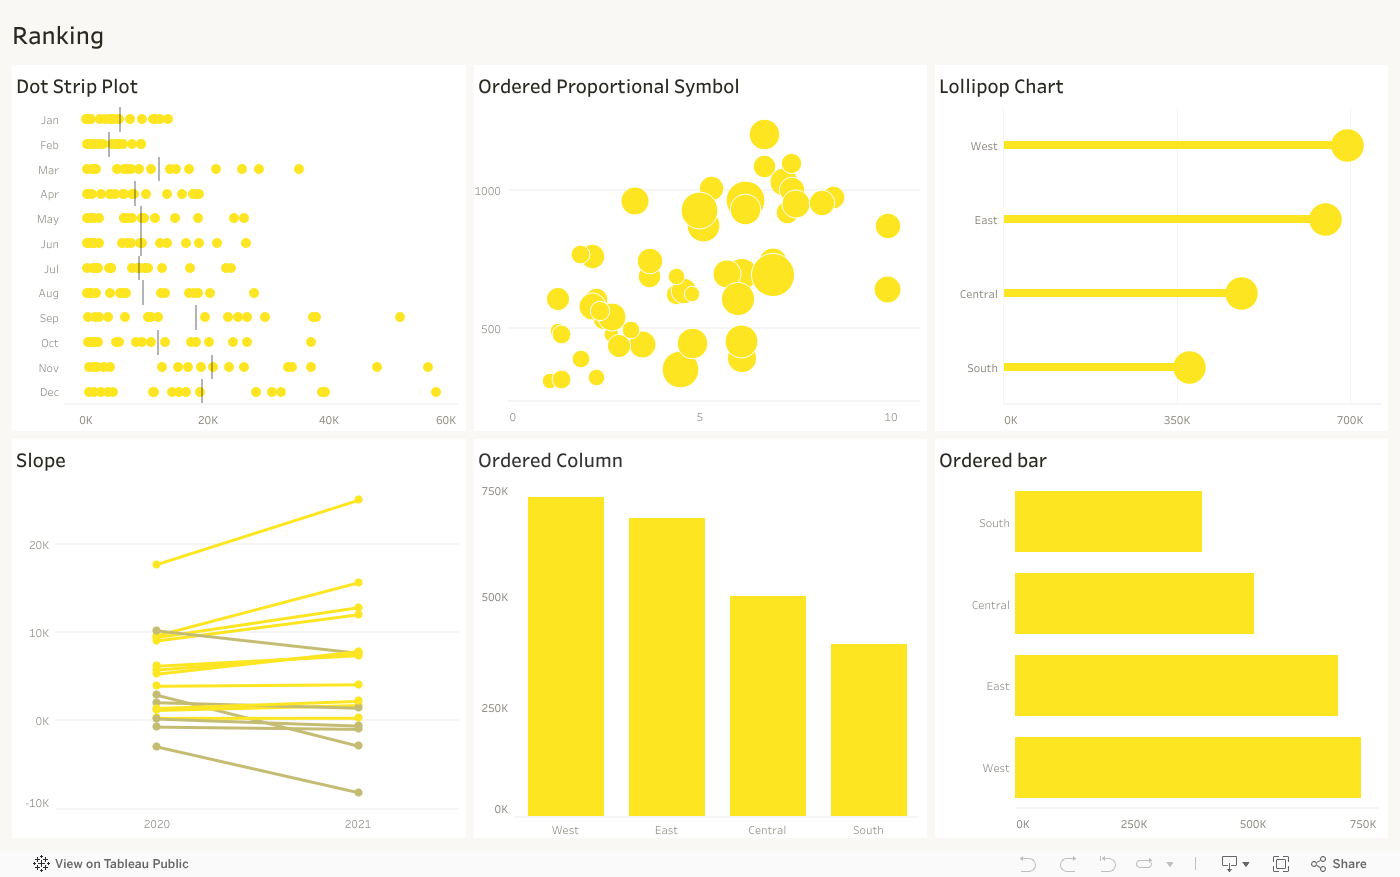
Tableau, launched in 2003, quickly emerged as a leading data visualization software platform. Its rapid growth can be attributed to its intuitive interface and powerful visual analytics capabilities. Now recognized as a premier business intelligence tool, Tableau empowers users to create visually appealing and insightful dashboards, making it indispensable for organizations aiming to harness data effectively. This illustrates why using Tableau is becoming increasingly popular among data professionals.
-
Which tool should you chose for data analysis?
In today’s data-driven business environment, tools such as Tableau and Excel are vital for informing decision-making. They help businesses convert raw data into actionable insights, uncover hidden trends, and simplify data visualization.