

In this article, we will describe the process of analyzing e-commerce data in the Google Analytics 4 environment, including E-commerce Analytics Examples.
E-commerce Analytics: What It Is and Why It’s Needed
E-commerce Analytics is a tool that allows for a detailed study of user behavior on websites that sell products or services. With e-commerce tracking, you can monitor every stage of the user journey—from the first website visit to making a purchase—and analyze various sales-related metrics.
Setting up e-commerce is the process of configuring analytics tools to track and analyze data on sales and user interactions with your site. This setup enables you to gain deeper insights into customer behavior, the effectiveness of marketing campaigns, and the overall performance of your online business.
There are several options for setting up e-commerce:
- By creating technical specifications for developers using Google’s documentation
- Manual setup through Google Tag Manager (the fastest but least accurate option)
- Through built-in functionalities of platforms/marketplaces (like WooCommerce, Magento, OpenCart, Shopify)
Problems Solved by E-commerce Tracking
- Tracking Key Metrics: You can monitor indicators such as the number of transactions, average order value, conversion rates, revenue, product popularity, and more.
- Sales Funnel Analysis: Understanding how users navigate your site—from the first visit to making a purchase—helps optimize the sales process.
- Evaluating Marketing Campaign Effectiveness: Determine which marketing channels lead to the highest number of sales and greatest profits.
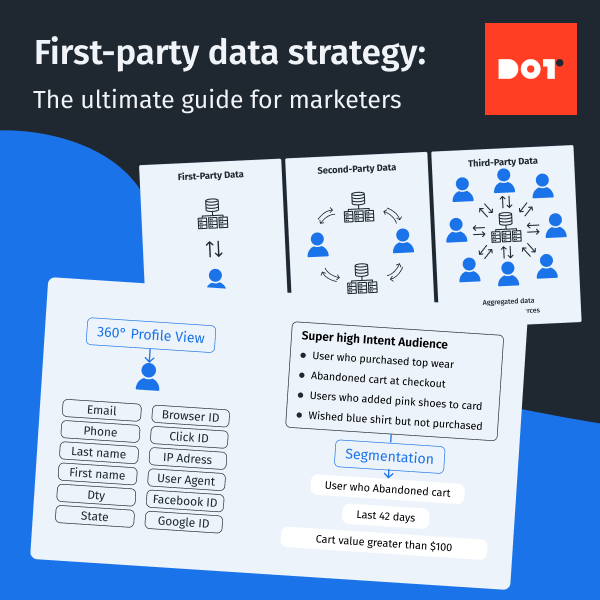
- Audience Segmentation: The ability to create user segments based on their purchasing behavior allows for more personalized advertising campaigns.
- Site Optimization: Analyzing data on user interactions helps identify site issues and improve the user experience.
Types of Metrics in E-commerce Analytics
When setting up e-commerce tracking, you can monitor two types of analytical metrics:
Quantitative Analytics
- Sales Metrics: Sales volume, average order value, purchase frequency, Customer Acquisition Cost (CAC).
- User Behavior: Number of visitors, number of sessions, time spent on the site, viewing depth, bounce rate.
- Marketing Analytics: Effectiveness of advertising campaigns (CTR, conversion rate), cost of customer acquisition(CAC) from different channels, conversion rates(CR) for key actions (purchases).
Qualitative Analytics
- Customer Reviews: Analysis of product and service reviews to identify strengths and weaknesses.
- Research: Surveys and focus groups to understand customer needs and preferences.
- Sales Funnel Analysis: Identifying stages where customers most often abandon their purchase.
Examples of Some E-Commerce Analytics Metrics and Their Applications
- Conversion Rate: Shows the percentage of visitors who perform a target action (e.g., make a purchase). A low conversion rate may indicate problems with website design, navigation, or the product/service itself.
- Average Order Value: Allows you to assess the average amount customers spend on a single order. Analyzing this metric helps determine which products or services are most popular and how to increase the average purchase amount.
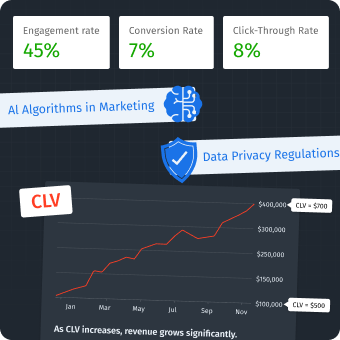
- Customer Lifetime Value (LTV): Estimates the total revenue a company earns from a single customer over the entire period of interaction. A high LTV indicates customer loyalty and the effectiveness of loyalty programs.
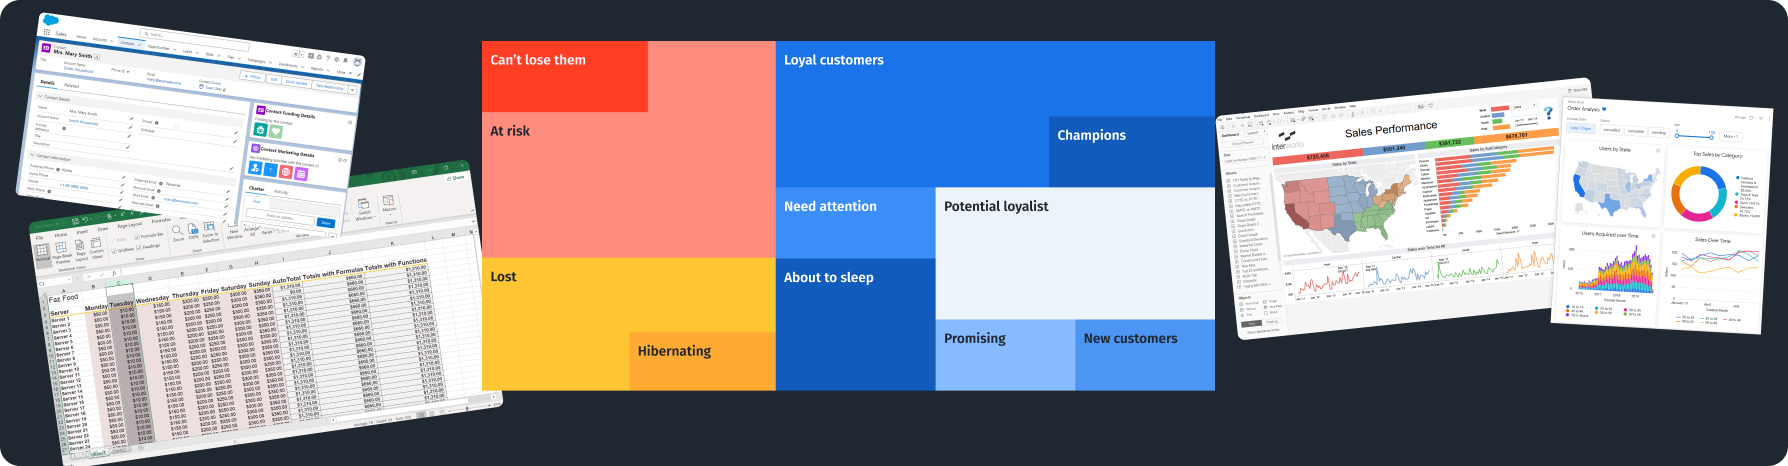
- Segmentation Analysis: Dividing customers into groups based on various criteria (age, gender, interests) allows for creating personalized offers and increasing the effectiveness of marketing campaigns.
- Sales Funnel Analysis: Helps identify bottlenecks in the purchasing process and optimize each stage.
Overview of Basic E-commerce Analytics Examples Using Google Analytics 4
Main Steps:
Setting Up E-commerce Tracking:
- Tracking Code: Ensure that the correct GA4 tracking code is installed on all pages of your website.
- Events: Configure events to track actions such as:
- view_item: Viewing a product
- add_to_cart: Adding a product to the cart
- begin_checkout: Initiating the checkout process
- purchase: Completing a purchase
– In the enhanced version of e-commerce, there are many more standard events. In this example, we use these four as the main stages of the funnel.
Event Parameters:
For accurate funnel construction, each event should include the following parameters:
- item_id: Unique product identifier
- item_name: Product name
- item_category: Product category
- price: Product price
- currency: Currency
- quantity: Number of products
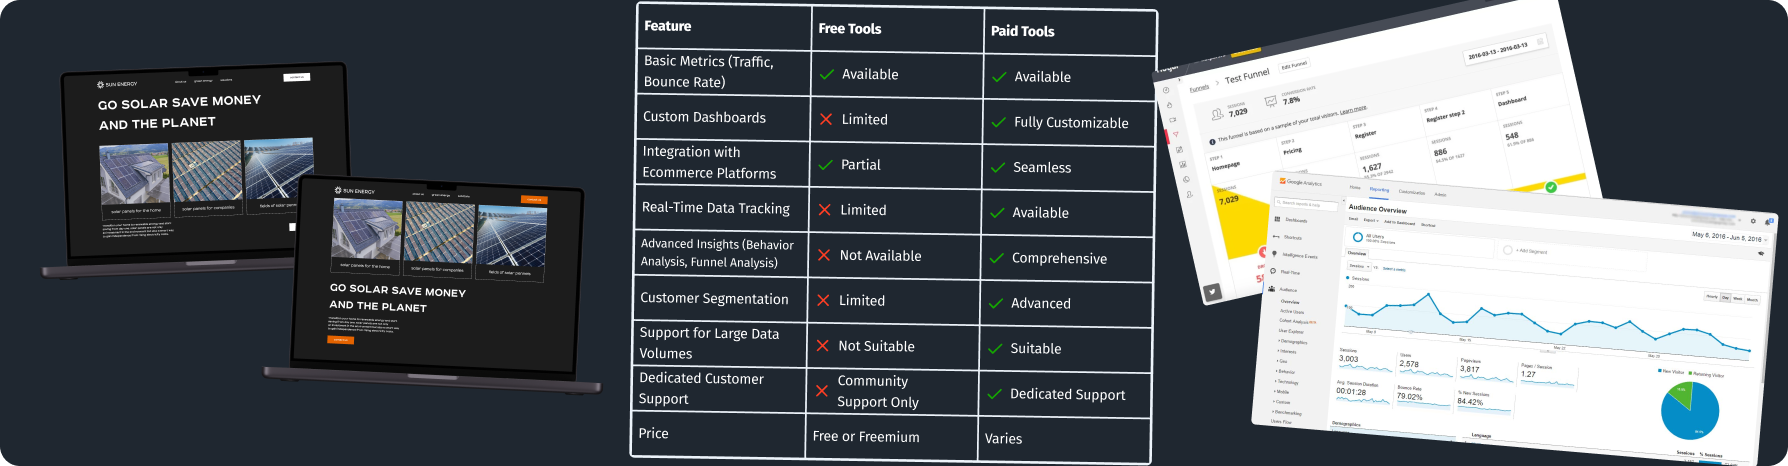
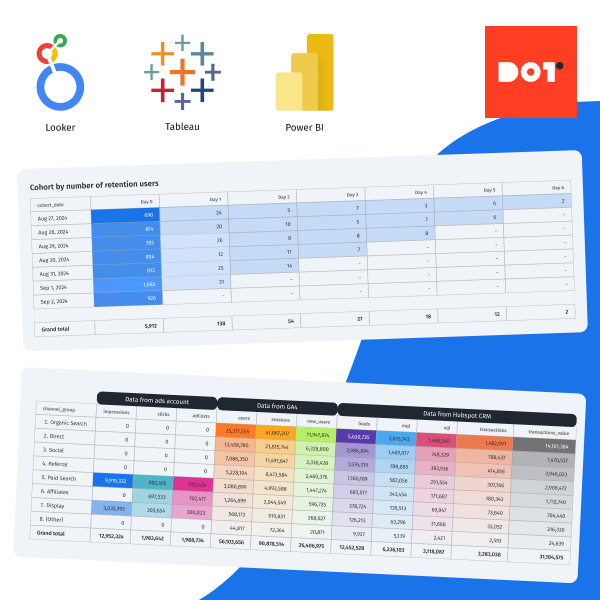
Standard Reports: GA4 offers a range of standard reports under the Monetization tab:
- Overview: Provides general information about sales and the number of users
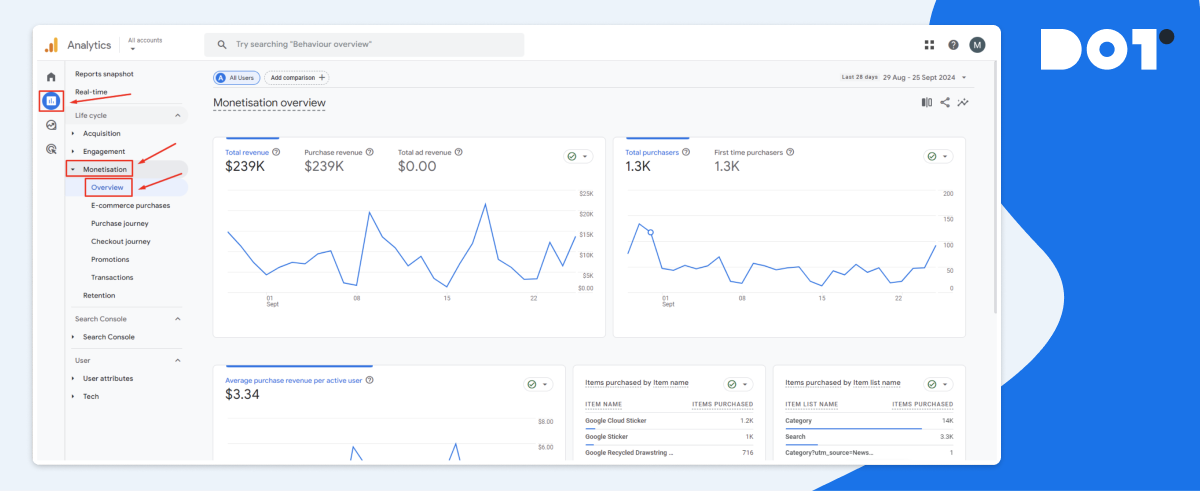
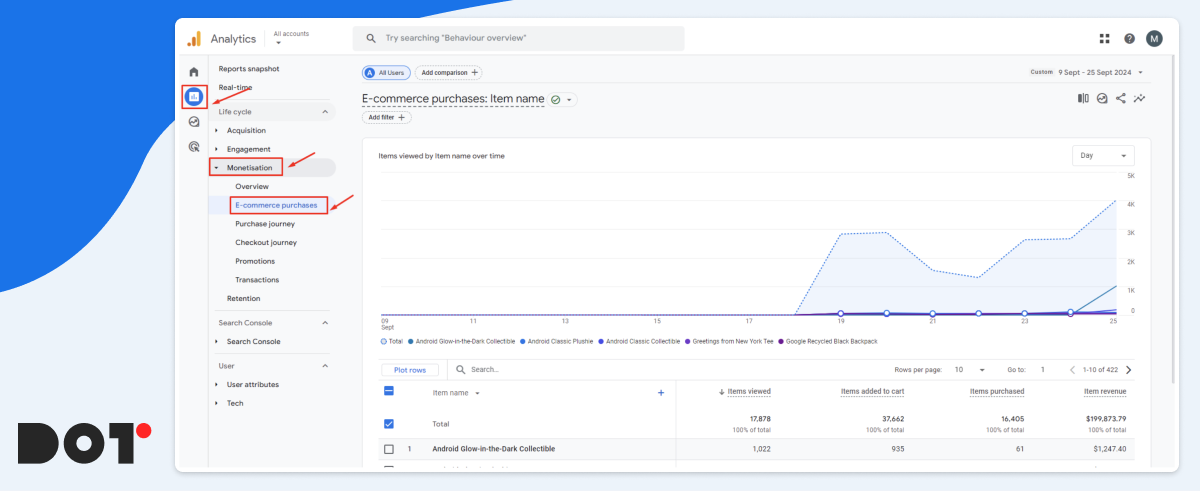
- Purchases: Provides detailed information about the number of funnel events and the revenue generated from each individual product.
- Path to Purchase: Displays how users navigate through the sales funnel on your e-commerce website or app.
By relying on the information presented in the basic reports, you can delve deeper into:
Revenue: Total revenue, revenue by product, revenue by traffic source.
Conversions: Number of purchases, conversion rate through the sales funnel.
User Behavior: Time on site, pages per session, average purchase value.
All the reports mentioned above can be further adjusted and customized to suit your needs. You can also create your own for more in-depth analysis using various dimensions and metrics.
Setting Up Display and Analysis of the Sales Funnel in E-commerce
The sales funnel visualizes the user’s journey from the first contact with your website or application to making a purchase. In GA4, this allows you to understand at which stages clients “drop off” and where potential problems may lie.
This information is contained in the standard report located under Monetization > Path to Purchase, but this time we will examine the necessary steps to create such a report in the Explorations section.
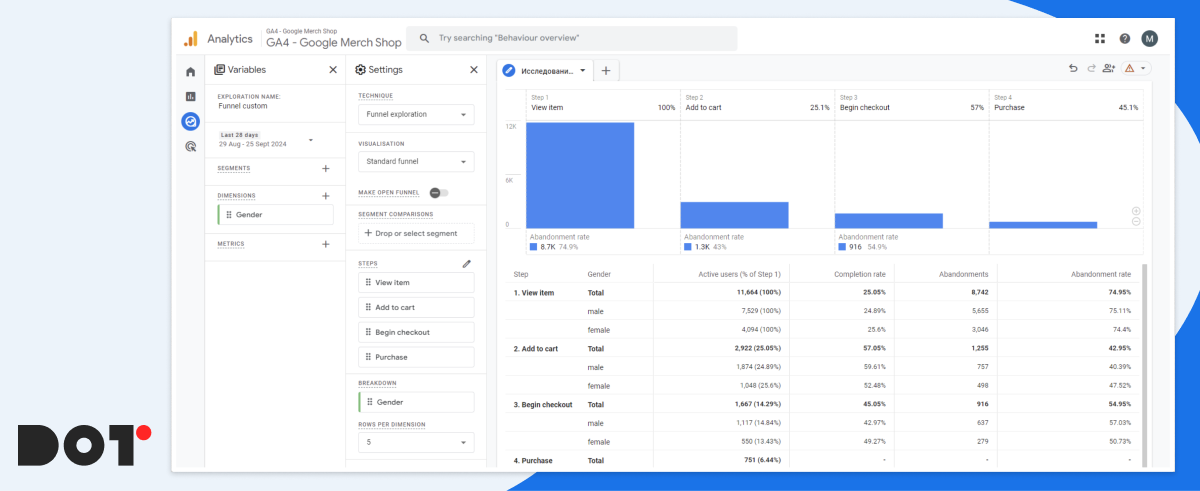
Steps to Create a Funnel in GA4:
- Defining Funnel Steps: For example, viewing a product page, adding to the cart, proceeding to checkout, and completing the purchase.
- Selecting Additional Parameters for Analysis: For instance, we need to understand which gender of users buy our products more frequently over a specified period.
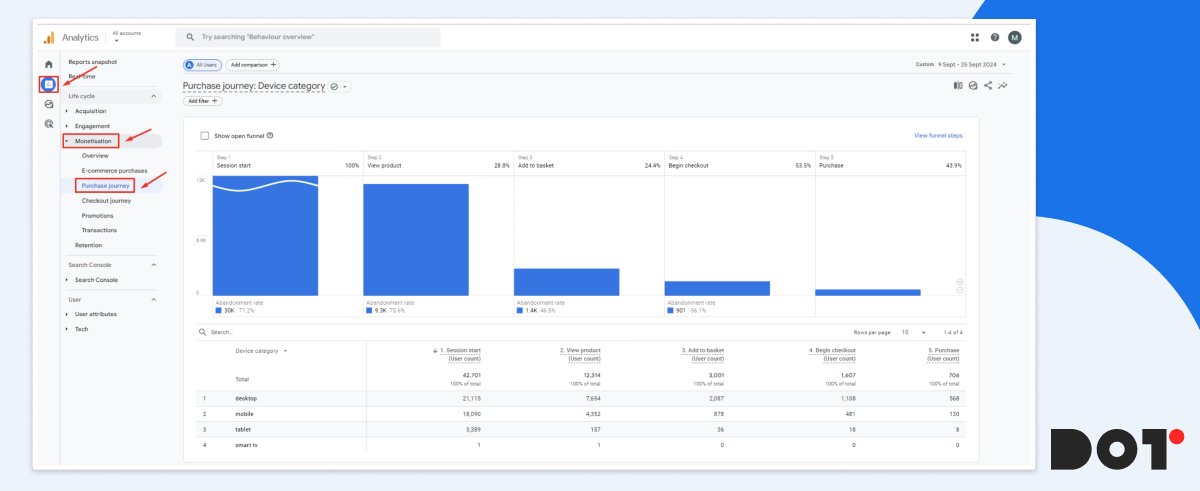
From the research, we see that during the period from August 25 to September 21, men purchased our products 70% more often than women. Therefore, it would be logical to launch a test advertising campaign targeting men and then compare its conversion rate with the overall rate to confirm the hypothesis.
Using the funnel, you can extract a lot of useful information, for example:
- Conversion at Each Stage: Assess what percentage of users moves from one stage to the next. A low conversion rate may indicate problems with design, content, or other factors.
- Time at Each Stage: Measure the average time users spend at each stage. A long duration may indicate difficulties in progressing through the funnel.
- User Drop-off: Identify stages where the highest user drop-off occurs. This helps pinpoint “bottlenecks” in the funnel.
- Data Segmentation: Use segmentation to compare the behavior of different user groups (e.g., new vs. returning users, mobile vs. desktop, men vs. women).
- Comparison with Historical Data: Track changes in conversion over time and compare them with periods before changes were made to the site or marketing campaigns.
E-commerce Analytics Examples from Dot Analytics
Case 1: Combating Abandoned Carts
Problem:
An online retailer noticed a high abandonment rate between the “Add to Cart” and “Begin Checkout” stages, it’s a typical e-commerce problem. Specifically, 68% of users who added items to their cart did not proceed to checkout, leading to significant lost revenue opportunities.
Solution:
Using Google Analytics 4, the team conducted a thorough analysis to identify where users were dropping off. They discovered that the checkout process was cumbersome, with lengthy forms and confusing instructions.
- Simplified the Checkout Form: Reduced the number of fields from 15 to 7 by eliminating unnecessary information requests.
- Enhanced User Guidance: Added clear, user-friendly error messages and tooltips to assist users in filling out the form correctly.
- Implemented Cart Saving Feature: Allowed unregistered users to save their carts, encouraging them to return and complete their purchases later.
Result:
After implementing these changes over a two-month period:
- Abandoned Cart Rate Decreased by 30%: Dropped from 68% to 47%, recovering potential monthly revenue of approximately $75,000.
- Average Order Value Increased by 12%: Increased from $80 to $90 as users found the checkout process more straightforward and added more items.
- Customer Satisfaction Improved: Positive feedback increased by 20%, indicating a better user experience.
Case 2: Personalizing Product Recommendations
Problem:
The company faced a low average order value (AOV) of $65. Customers typically purchase single items without adding complementary products, limiting revenue potential per transaction.
Solution:
Analyzed customer purchase history and on-site behavior using GA4’s enhanced tracking features.
- Developed a Personalized Recommendation Engine: Used ML algorithms to suggest products that complemented customers’ previous purchases or items viewed.
- Integrated Recommendations Across the Site: Placed personalized suggestions on product pages, the shopping cart, and during the checkout process.
Result:
Within three months:
- Average Order Value Increased by 25%: Rose from $65 to $81.25.
- Repeat Purchase Rate Grew by 18%: Customers returned more frequently, increasing overall sales.
- Overall Revenue Increased by 22%: Monthly revenue grew due to higher transaction values and repeat business.
Case 3: Analyzing the Effectiveness of Advertising Campaigns
Problem:
The company was spending heavily on advertising ($100,000 per month) but saw a low return on investment (ROI). The Customer Acquisition Cost (CAC) was high at $50, while the conversion rate remained low.
Solution:
Conducted a detailed assessment of all advertising campaigns using GA4.
- Identified High-Performing Channels: Found that social media ads had a conversion rate of 4%, while display ads were at 1.5%.
- Reallocated Budget: Shifted 40% of the budget from underperforming channels (display ads) to high-performing ones (social media and search ads).
- Optimized Ad Content: Adjusted messaging and creatives based on the preferences of the most responsive audience segments.
Result:
Over the next quarter:
- Reduced Advertising Costs by 15%: Cut monthly ad spend to $85,000 without losing reach.
- Increased Conversion Rate by 20%: Overall conversion rate improved from 2% to 2.4%.
- Lowered CAC to $35: Improved efficiency in spending led to a more sustainable acquisition cost.
- Boosted Monthly Revenue by 28%: Increased sales due to more effective targeting and higher conversion rates.
Case 4: Identifying the Most Profitable Customer Segments
Problem:
The marketing efforts were not yielding desired results due to a lack of understanding of the most profitable customer segments. The company was targeting a broad audience, leading to inefficient use of the marketing budget.
Solution:
Used GA4 to segment customers based on demographics, purchase history, and online behavior.
- Segmented the Audience:
- Segment A: Young adults (18-25) interested in budget-friendly products.
- Segment B: Professionals (26-40) with a preference for premium items.
- Segment C: Seniors (60+) focused on ease of use and reliability.
- Developed Tailored Marketing Strategies: Created personalized campaigns for each segment, such as discounts for Segment A, premium bundles for Segment B, and simplified product guides for Segment C.
- Personalized Communication Channels: Used social media for Segment A, email newsletters for Segment B, and traditional media for Segment C.
Result:
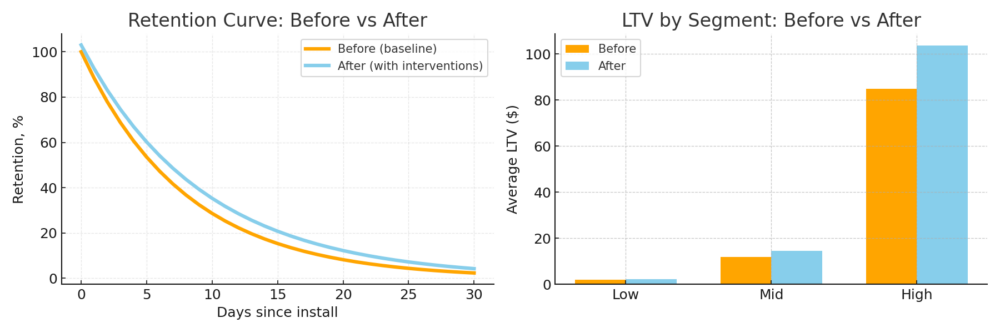
After implementing these strategies over six months:
- Increased Customer Loyalty by 35%: Measured by repeat purchases and customer engagement metrics.
- Grew Average Customer Lifetime Value (LTV) by 40%: LTV increased from $250 to $350.
- Improved Marketing ROI by 50%: More efficient use of the budget led to higher returns per dollar spent.
- Enhanced Overall Sales by 30%: Contributed an additional $200,000 in quarterly revenue.
Conclusion
These case studies illustrate the practical applications of Google Analytics 4 in solving common e-commerce challenges:
- Data-Driven Decisions: Leveraging analytics to inform strategies leads to measurable improvements.
- Customer-Centric Approaches: Personalization and segmentation enhance customer experience and loyalty.
- Efficient Resource Allocation: Analyzing performance helps optimize marketing spend and increase ROI.
By adopting similar methodologies, businesses can optimize their online operations, enhance user experience, and significantly boost their bottom line.
Take the Next Step with Dot Analytics
At Dot Analytics, we’re dedicated to helping businesses like yours overcome these challenges. Our expertise in Google Analytics 4 enables us to provide comprehensive solutions for:
- E-commerce Tracking Setup: We’ll ensure your GA4 is correctly configured to capture all essential e-commerce events and parameters.
- Customized Reporting: Tailor your analytics to focus on the metrics that matter most to your business.
- In-depth Data Analysis: Our team can help you interpret complex data to uncover actionable insights.
- Optimization Strategies: From reducing cart abandonment to enhancing customer segmentation, we’ll guide you through strategies that drive results.
- Marketing Efficiency: Optimize your advertising spend by identifying the most profitable channels and audience segments.
Let Dot Analytics be your partner in transforming data into growth opportunities. Contact us to discover how we can assist you in maximizing your e-commerce potential and achieving your business goals.


Leave a Reply