

Introduction
Learning about product analytics examples can change how you improve products for your audience. Using the right insights can help you do better than your competitors in today’s market. This article explains practical ways to use product analytics. We will talk about qualitative and quantitative approaches, aligning KPIs, choosing the right tools, gaining actionable insights, and making effective decisions. All these tips will help you improve your product strategy, especially through the use of product performance metrics.
Common Methods of Product Analytics
Qualitative Techniques: Customer Feedback and Interviews
Customer feedback is very valuable for understanding user experiences and preferences. Here’s how to collect and analyze qualitative data effectively:
Surveys:
- Designing Effective Surveys: Create questions that get useful feedback. Use a mix of closed and open-ended questions. For example, ask “On a scale of 1-10, how likely are you to recommend our product?” and also “What features do you value the most and why?” One of the product analytics examples here is to test how users respond to new features using feedback from surveys.
- Distribution Channels: Send out your surveys through different ways like email, in-app messages, or social media. Offer incentives like discounts or early access to new features to get more responses. Utilizing customer feedback analysis can boost the effectiveness of your survey designs.
User Interviews:
- Preparation: Choose a mix of users that represent your target group. Aim for 5-10 interviews to gather different views. Prepare questions about user challenges, what they enjoy about your product, and any improvements they want. Product analytics examples of this include asking direct questions about user pain points.
- Conducting the Interviews: Hold one-on-one or small group interviews either in person or online. Create a friendly atmosphere to encourage sharing. Use audio or video recording tools (with permission) to capture detailed responses for later analysis. The insights from these interviews can significantly enhance your user behavior analysis.
These qualitative insights help you see user emotions and motivations that numbers can’t show. After you collect data, look for common themes and use these findings in your product development plans.
Quantitative Approaches: Surveys and Usage Data Analysis
Quantitative data is important for setting benchmarks and tracking performance. Here’s how to collect and analyze quantitative insights:
Surveys:
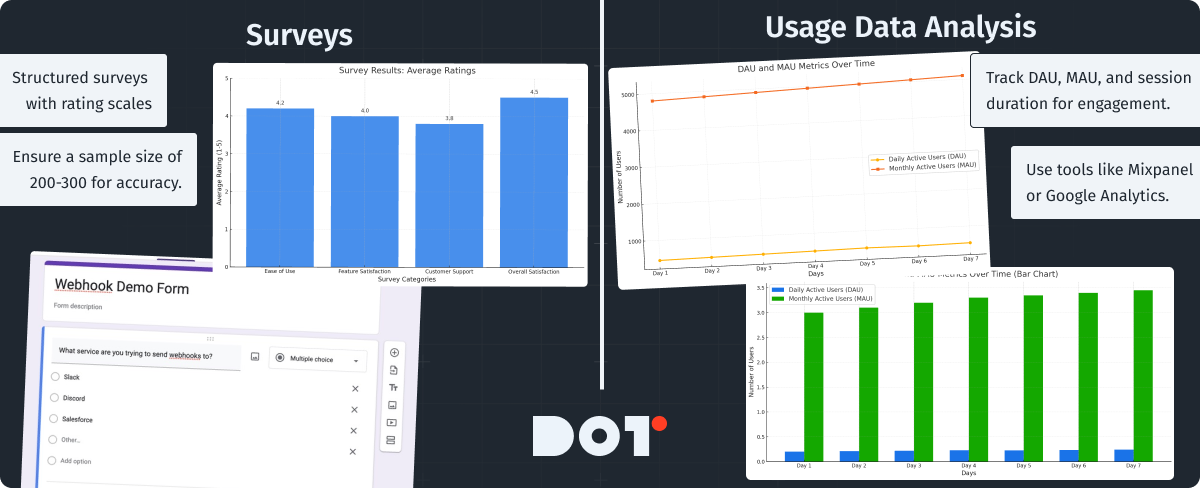
- Creating Structured Surveys: Along with open-ended questions, use rating scales (like 1-5) to measure attitudes toward specific features or overall satisfaction. This helps you perform statistical analysis later. Utilize product analytics examples to improve your survey strategies based on past data.
- Sample Size: Choose your sample size based on your customer base to ensure accuracy. If you have many users, get at least 200-300 responses for better results.
Usage Data Analysis:
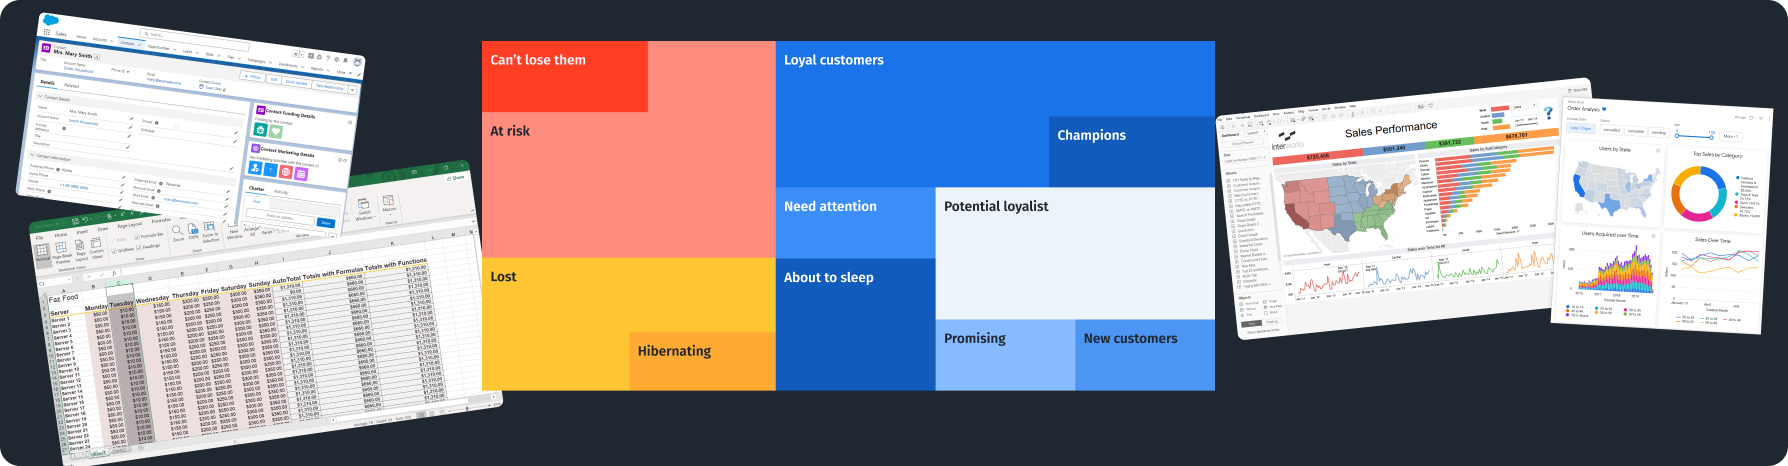
- Data Collection Tools: Use tools like Mixpanel, Google Analytics, or Amplitude to gather information on user interactions. Keep an eye on important metrics like:
- Daily Active Users (DAU): The number of unique users who use your product each day.
- Monthly Active Users (MAU): The number of unique users interacting with your product in a month, showing user retention.
- Session Duration: The average time users spend on your platform, showing how engaged they are.
Combining qualitative feedback with quantitative data gives you a complete view of your product’s performance, helping you make better decisions. In the context of product analytics examples, understanding which features retain users can guide future enhancements and contribute to your conversion rate optimization strategies.
Behavior Tracking: Tools for Monitoring User Interactions
Behavior tracking tools are important for understanding user interactions closely. Here’s how to use these tools well:
Heatmaps:

- Look at sections that get little clicks to find usability issues. For example, if a call-to-action button is not clicked much, consider changing its position or testing its color or size. This will also help in your feature usage tracking efforts.
- Tools like Hotjar or Crazy Egg show where users click, scroll, or hover on your website. Sign up, add a tracking code to your product, and study heatmaps to see which parts of your interface are most engaging. This is another area where product analytics examples come into play, as you can analyze heatmaps from successful products.
Session Replay:
- Tools like FullStory or Inspectlet let you replay user sessions. This gives you a closer view of how users navigate your product and shows any problems they might face. Incorporating product analytics examples in your analysis frequently reveals user frustrations while aiding in data-driven product decisions.
- Watch for patterns. If many users abandon a checkout page at the same point, it might indicate an obstacle like unclear instructions or a confusing interface.
Using these behavior-tracking techniques helps you gain useful insights into user engagement, allowing you to improve product functionality and user experience.
Identifying Key Performance Indicators (KPIs)
Determining Your Objectives: Aligning KPIs with Business Goals
Identifying KPIs starts with understanding your business goals. Follow these steps:
Set Clear Objectives:
Think about what you want to achieve with your product. You might want to improve user retention, increase customer satisfaction, or raise conversion rates. These goals should be Specific, Measurable, Achievable, Relevant, and Time-bound (SMART). For instance, a product analytics examples goal could be to increase user retention by 20% within six months.
Engage Stakeholders:
- Organize workshops with different team members, from product managers to marketing staff, to discuss potential KPIs.
- Gather ideas about what influences product success.
- Use charts or diagrams during these sessions to help discussions.
Making sure your KPIs align with business objectives means you’ll track important metrics and keep your team focused on growth.
Choosing Relevant Metrics: What to Measure for Success
Next, choose KPIs that help measure your success. Here are some important metrics to consider:
- User Retention Rate: Find the percentage of users who come back after their first interaction with your product. Formula: (Number of users at the end of a period – Number of new users during that period) / Number of users at the start of the period x 100. A high retention rate means users are satisfied and reflects effective product analytics examples.
- Net Promoter Score (NPS): This simple metric shows customer loyalty. Ask users to rate on a scale of 0-10 how likely they are to recommend your product. Classify users into promoters (9-10), passives (7-8), and detractors (0-6) to measure overall satisfaction and understanding of user feelings.
- Churn Rate: This shows how many users stop using your product over a certain period. Calculate it by dividing the number of customers lost in a time frame by the total number of customers at the start, then multiply by 100 for a percentage.
Tracking these metrics carefully gives you a guide toward achieving product goals and helps you make proactive strategy changes. Using your product performance metrics effectively can also contribute to deeper insights into user engagement.
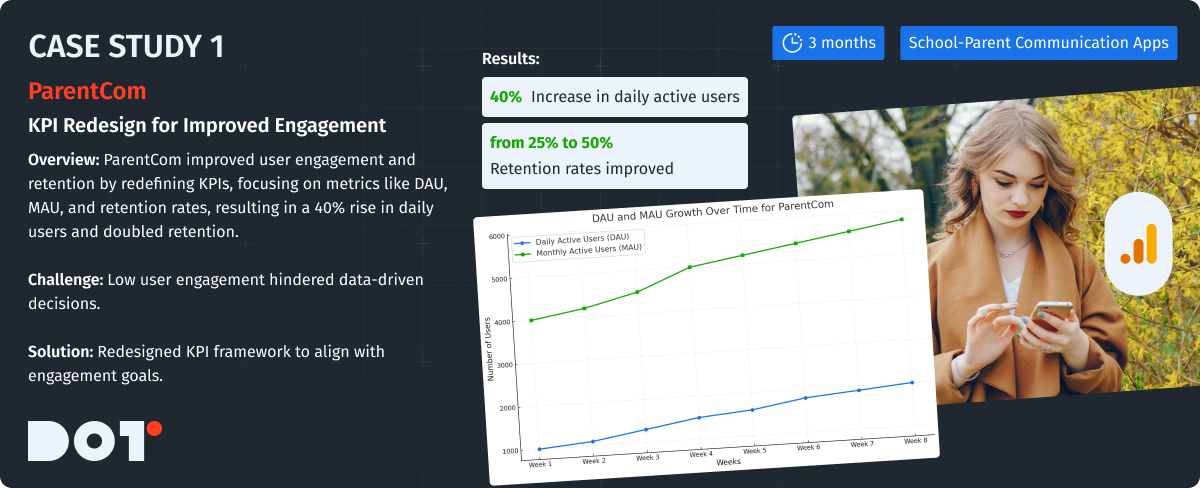
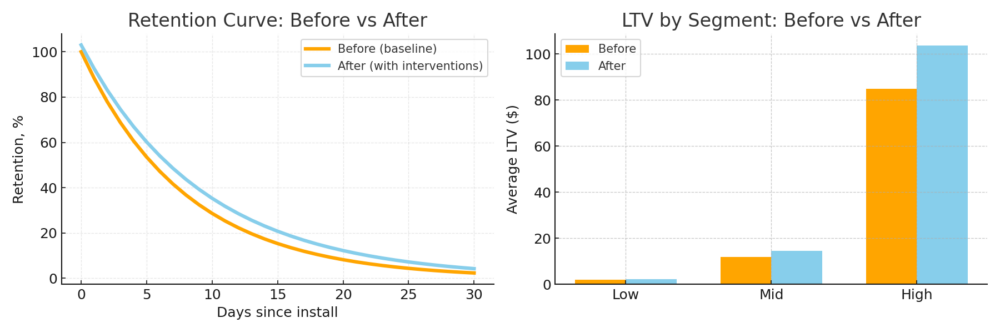
Case Study: ParentCom’s Approach to Defining KPIs for Their Communication App
Company Overview:
ParentCom is a mobile app that helps improve communication between schools and parents with alerts and updates.
Challenge:
ParentCom struggled with low user engagement, making it hard to use data for smart decision-making.
What They Did:
The team redesigned its KPI framework to match user engagement goals.
How They Did It:
- Workshop Sessions: They held sessions with input from parents and school staff to identify pain points.
- KPI Selection: They focused on key metrics:
- Daily Active Users (DAU)
- Monthly Active Users (MAU)
- Retention rates for the first 30 days after installation.
Team Composition:
The team included product managers, designers, and data analysts. Following product analytics examples to refine their approach helped them understand user needs.
Project Duration:
This project took three months to ensure thorough discussions.
Technologies Used:
They used Google Analytics for tracking users and a CRM tool to collect feedback.
Results:
After this KPI-focused approach was put in place, ParentCom saw a 40% rise in daily active users and an increase in user retention from 25% to 50%, showing the power of defined KPIs.
Tools and Software Examples for Product Analytics
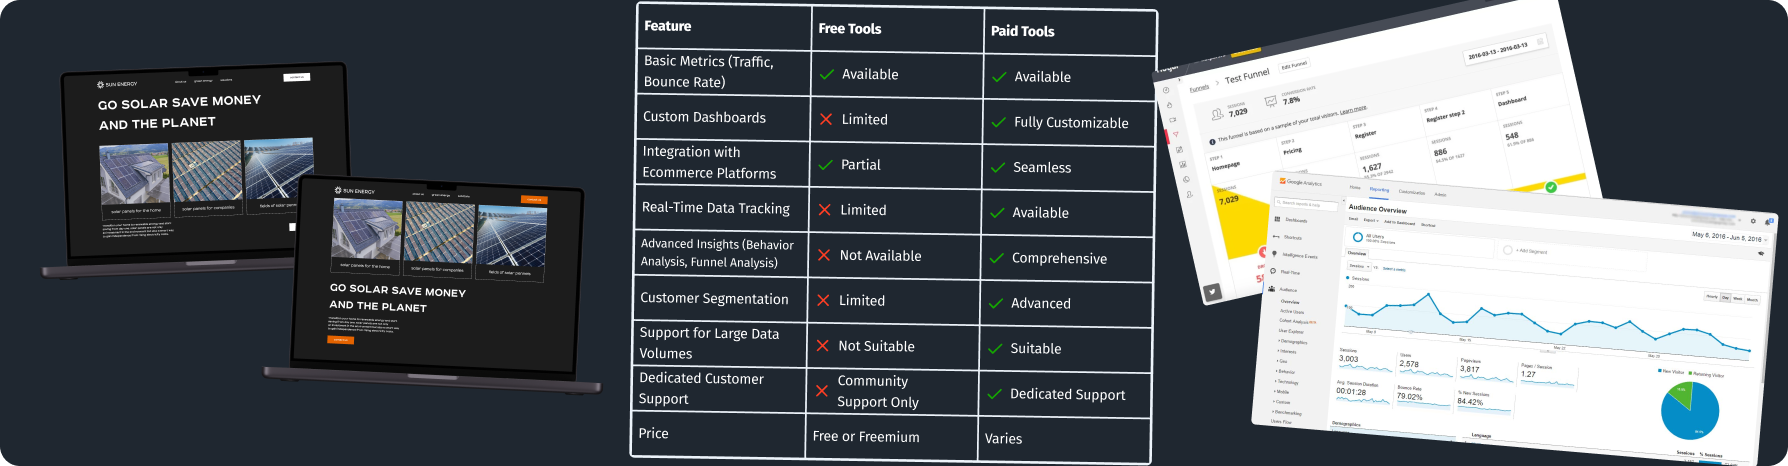
Popular Analytics Platforms
Using the right analytics tool makes it easier to gather and understand product data. Here’s a look at some popular options:
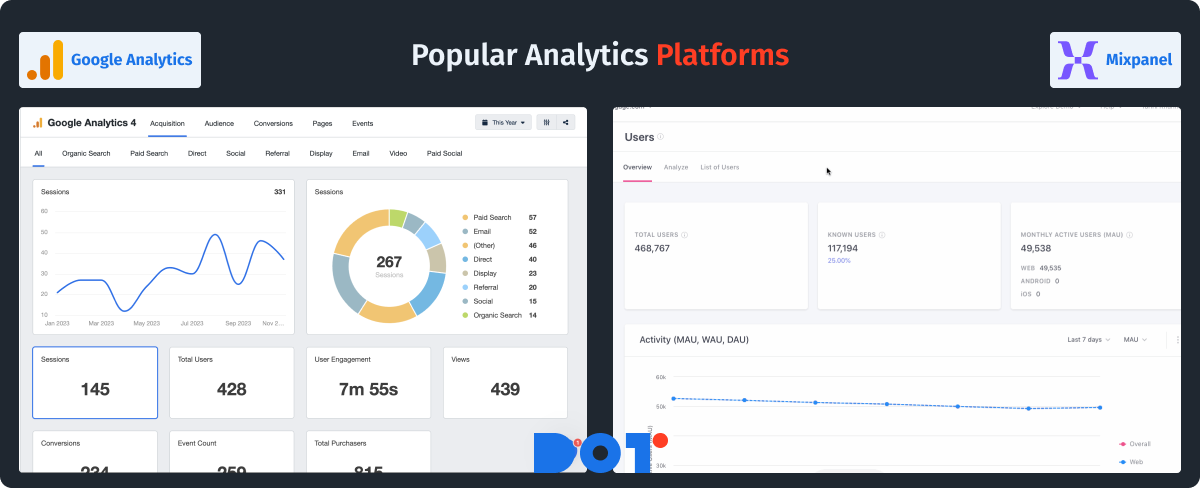
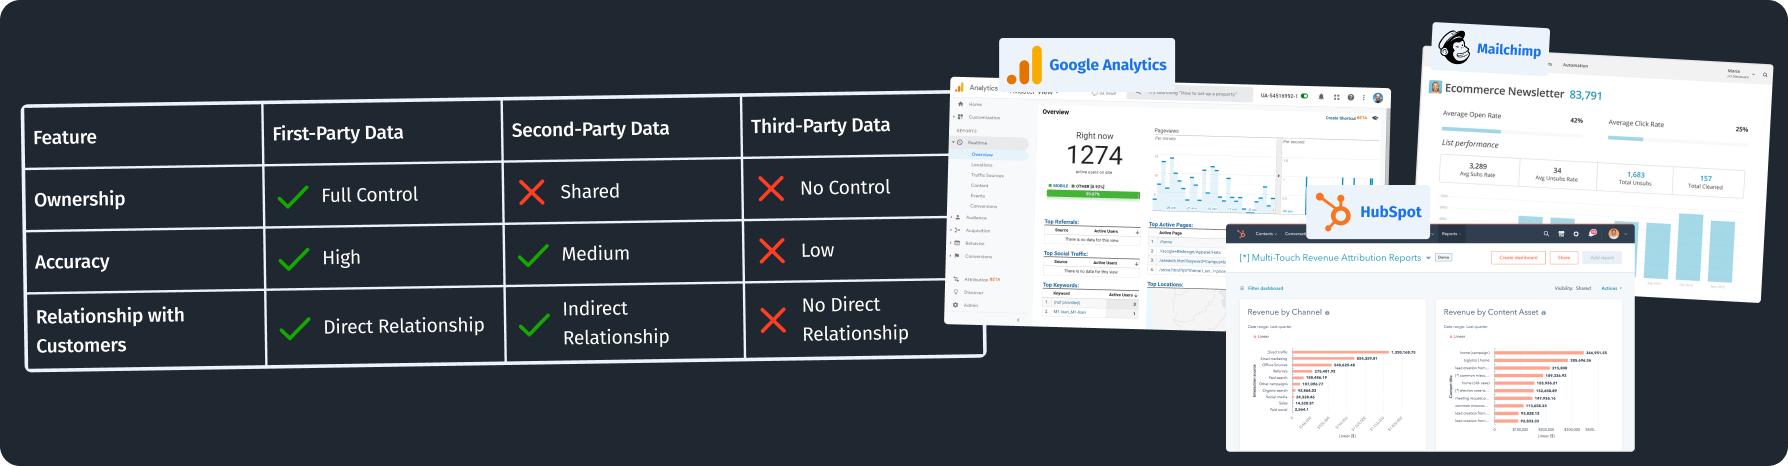
Google Analytics:
- Best For: Analyzing website traffic and user demographics. Create an account, install the tracking code, and start observing user behavior with real-time analytics and reports. This may include tracking successful product analytics examples based on user engagement metrics.
- Utilization: Use features like audience segmentation to understand user behavior, monitor conversion rates to see how users complete actions, and track goals to measure effectiveness. This tool provides critical support for your data-driven product decisions.
Mixpanel:
- Best For: Behavioral tracking. This is great if you need detailed data about how users interact with your features.
- Key Features: Track specific events (like clicks on a feature), segment users based on actions, and create funnels to visualize conversion paths. Its extensive feature usage tracking abilities can help you refine product offerings.
Using these platforms gives you deep insights to impact product strategy directly and can serve as vital product analytics examples in action.
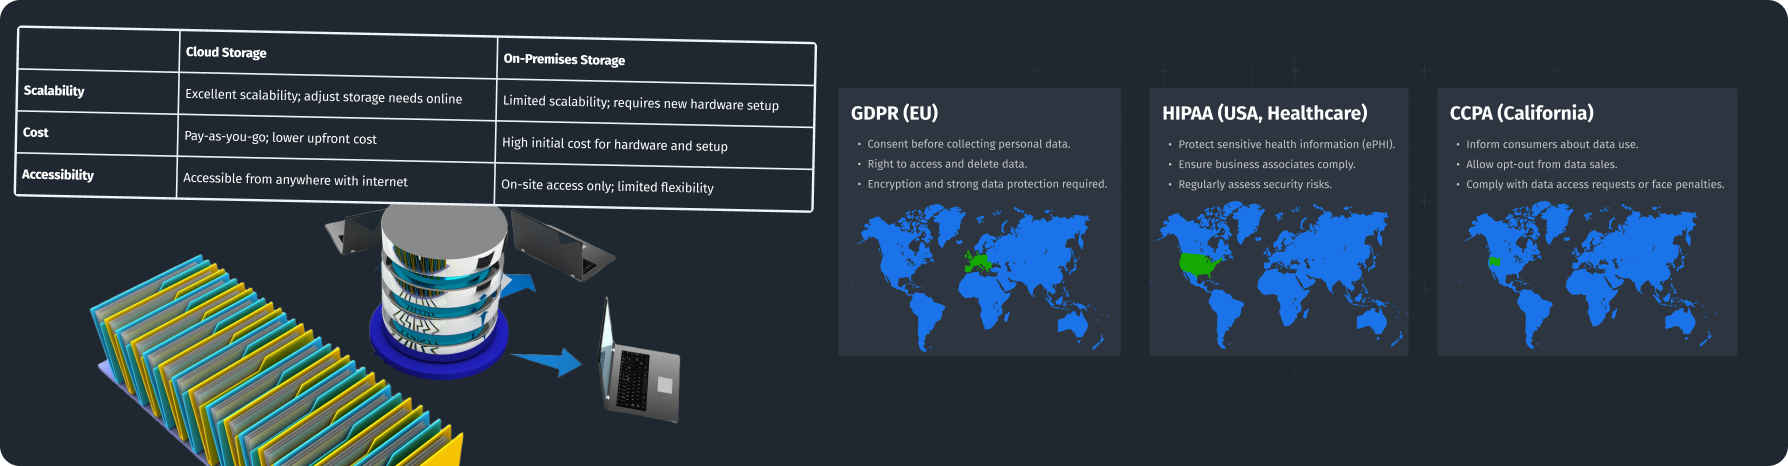
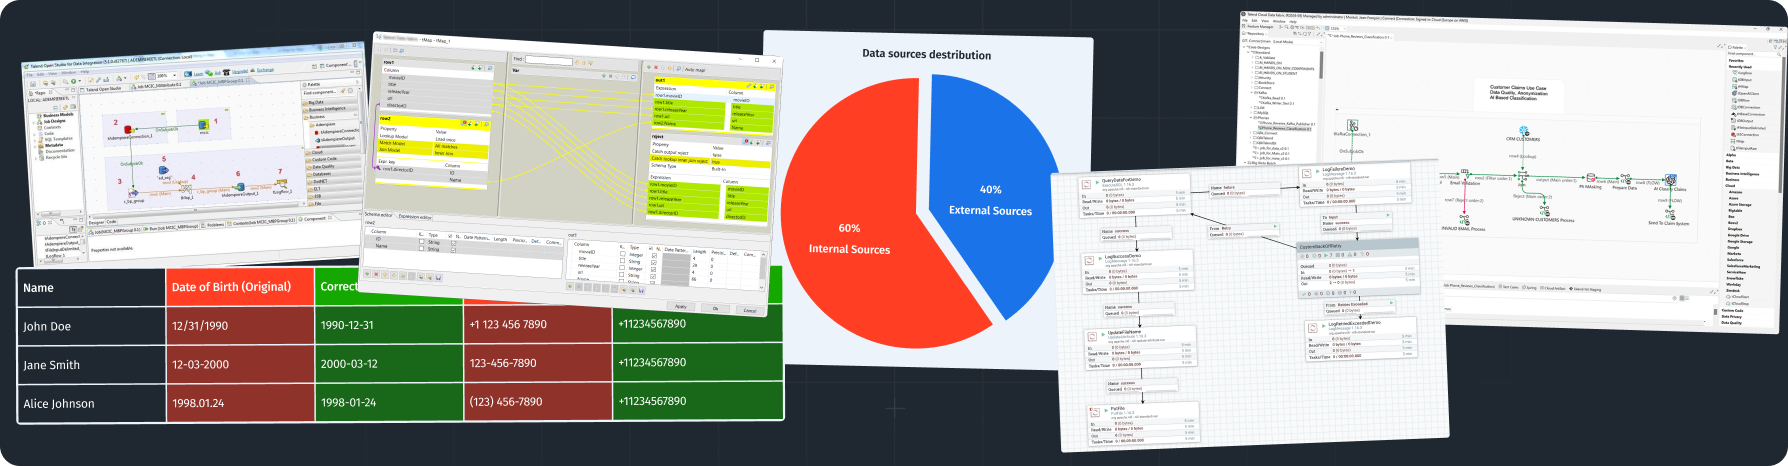
Integrating Software
It’s important to combine different data sources for a full understanding of product performance.
Here’s how to approach integration:
Using Automation Tools:
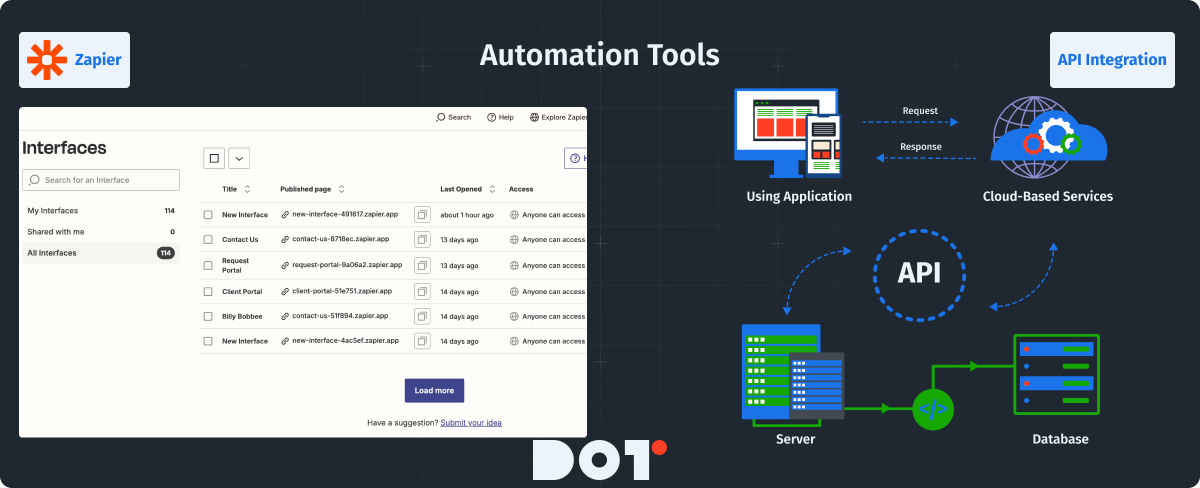
- Zapier: This tool automates processes by connecting different apps. For example, if a user gives feedback through your CRM, Zapier can automatically send that to Google Sheets for easy tracking.
- API Integration: Enable APIs between your analytics tools if direct connections are available. For instance, linking Google Analytics with a support tool helps match feedback with usage data, showcasing effective product analytics examples.
Best Practices for Selecting the Appropriate Software
To choose the best product analytics software, follow these steps:
- Define Your Needs:
Outline what insights you need from your analytics tools. Think about functions like user tracking, reporting capabilities, or integrations. - Trial Multiple Options:
Most platforms have trial periods. Use this opportunity to explore the interface and features before committing. - Consider Scalability:
Make sure the software can grow with your user base and data needs without significantly raising costs. - Assess Community Support:
Choose tools with active user communities and support forums. Resources like documentation and webinars can be very helpful, including those that mention product analytics examples.
Picking the right analytics tools ensures you can gain insights that help your product succeed.
Want to see how this applies to your business? Schedule a free 20-minute consultation with one of our experts.
Actionable Insights from Product Analytics Examples
Translating Data into Action: Recognizing Trends and User Behaviors
To convert data into useful insights, follow these steps:
- Regular Trend Analysis: Collect and analyze data to find patterns. Set specific days to review data and observe changes in user engagement which will include product analytics examples to help illustrate points.
- A/B Testing: Make changes based on insights. When redesigning a feature or changing marketing copy, use A/B testing to see which version works better.
This repeated process of analyzing and testing helps continuously improve product offerings.
Illustrative Insights: Changes That Drove Performance Improvement
Here’s an example of how specific changes based on analytics can lead to big improvements. Consider a fictional app named “FitTrack,” which helps users track fitness activities.
Initial Data Review:
The FitTrack team found through heatmap analysis that users weren’t engaging with a new workout feature because it was hard to see on the app interface.
Action Taken:
The team redesigned the homepage to make the “Workout” feature more visible. A/B tests showed that moving it to the top increased user interaction. For future updates, they referred back to effective product analytics examples to measure success.
Results:
Over two weeks, they saw a 35% rise in users accessing the workout feature, leading to better overall app engagement and positive user feedback about navigation.
Case Study: SchoolMessenger’s Use of Analytics to Enhance Parent Engagement Notifications
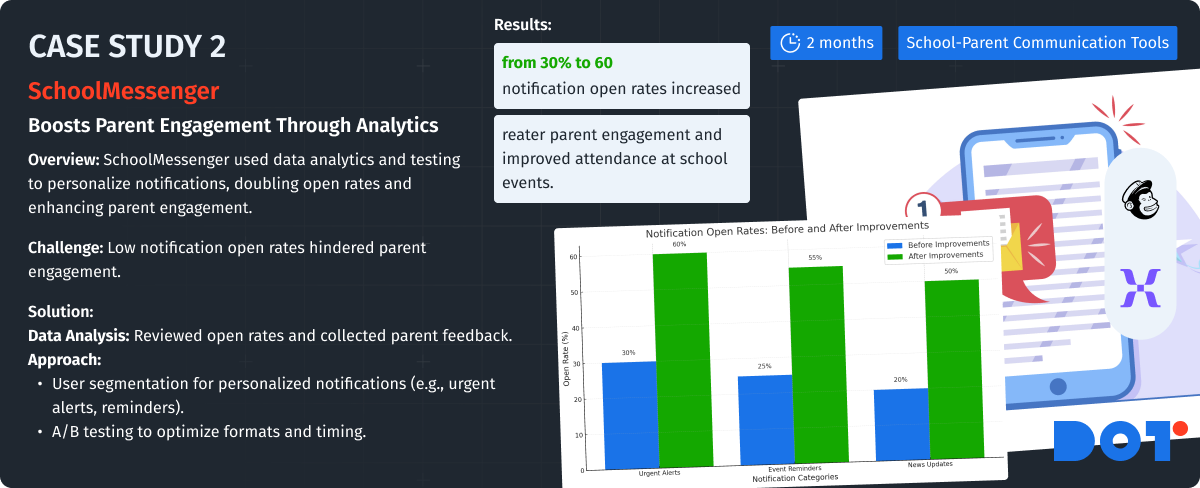
Company Overview:
SchoolMessenger provides tools to improve communication between schools and parents.
Challenge:
The company dealt with low open rates for notifications sent to parents, impacting user engagement.
What They Did:
- Data Analysis:
The team analyzed notification open rates and gathered feedback from parents about the types of information they valued. - User Segmentation:
They classified notifications like urgent alerts, event reminders, and news updates, timing them based on user preferences. - A/B Testing:
They tested different formats and sending times to see which led to more opens. This demonstrated how product analytics examples could be pivotal in engagement strategies.
Team Composition:
The initiative included product managers, data scientists, and marketing specialists.
Project Duration:
The whole analysis and testing took about two months.
Technologies Used:
They used Mixpanel for user interaction analysis and Mailchimp for notifications.
Results:
These efforts improved open rates from 30% to 60%. This led to increased parent engagement and more attendance at school events.
Frequency of Analyzing Product Metrics
Establishing a Consistent Review Schedule: Daily, Weekly, or Monthly?

It’s important to set a schedule for reviewing metrics to improve your product:
- Daily Tracking: Track metrics for fast-paced products. For instance, for a marketing campaign, check key metrics like visits and conversions daily to get quick feedback.
- Weekly Reviews: Monitor user engagement metrics like DAU and feature usage weekly. Early findings help spot signs of user issues or trends.
- Monthly Analysis: Conduct a more detailed review of bigger metrics like revenue or quarterly performance to evaluate strategies and make long-term adjustments.
Indicators for Reassessing Analysis Frequency Based on Product Evolution
Adjust your analysis schedule based on how your product grows:
Product Changes: If you launch major updates or new features, increase analysis frequency to keep the user experience high.
User Growth: As your user base grows, change how often you analyze metrics to capture more insights. This includes adjusting to findings from product analytics examples that highlight user adjustments.
Creating a Balanced Strategy to Prevent Analysis Paralysis
Avoid too much data to keep your team effective:
Focus on the most critical KPIs during each session to get actionable insights without becoming overwhelmed, which is a lesson often reinforced by product analytics examples.
Having a balanced review schedule helps improve consistently while ensuring important areas get needed attention.
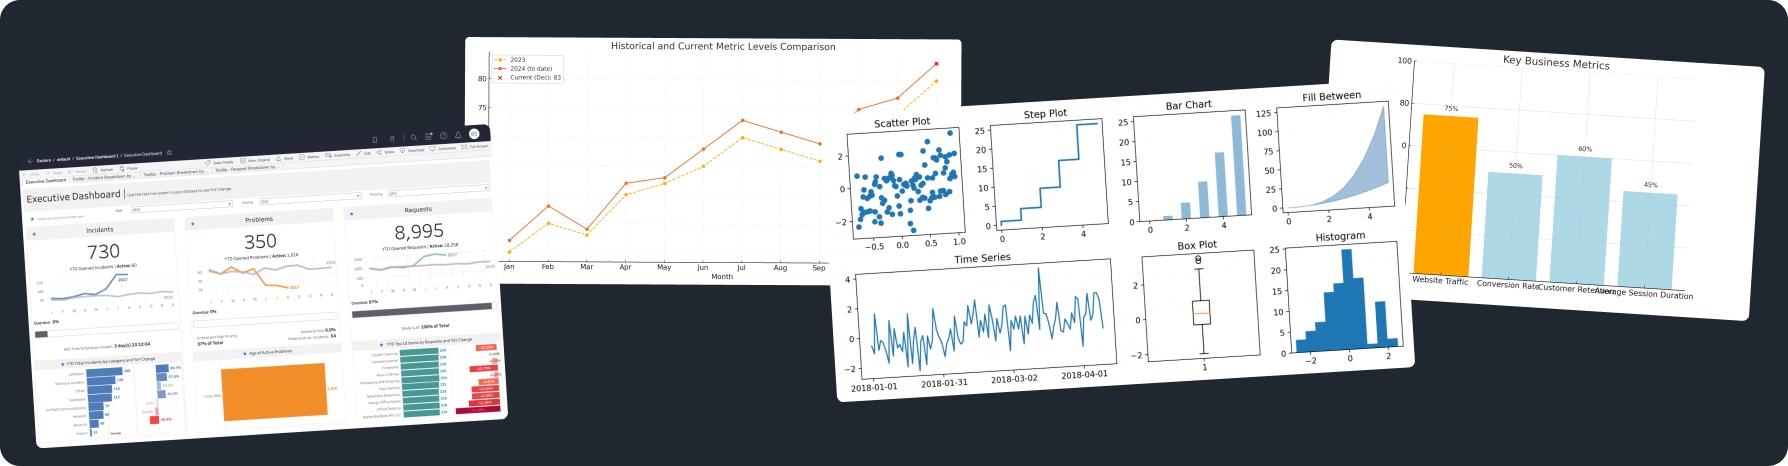
Best Practices for Interpreting and Visualizing Analytics
Selecting the Optimal Visualization Tools
Visualizing your data can turn numbers into stories. Here are the tools to use:
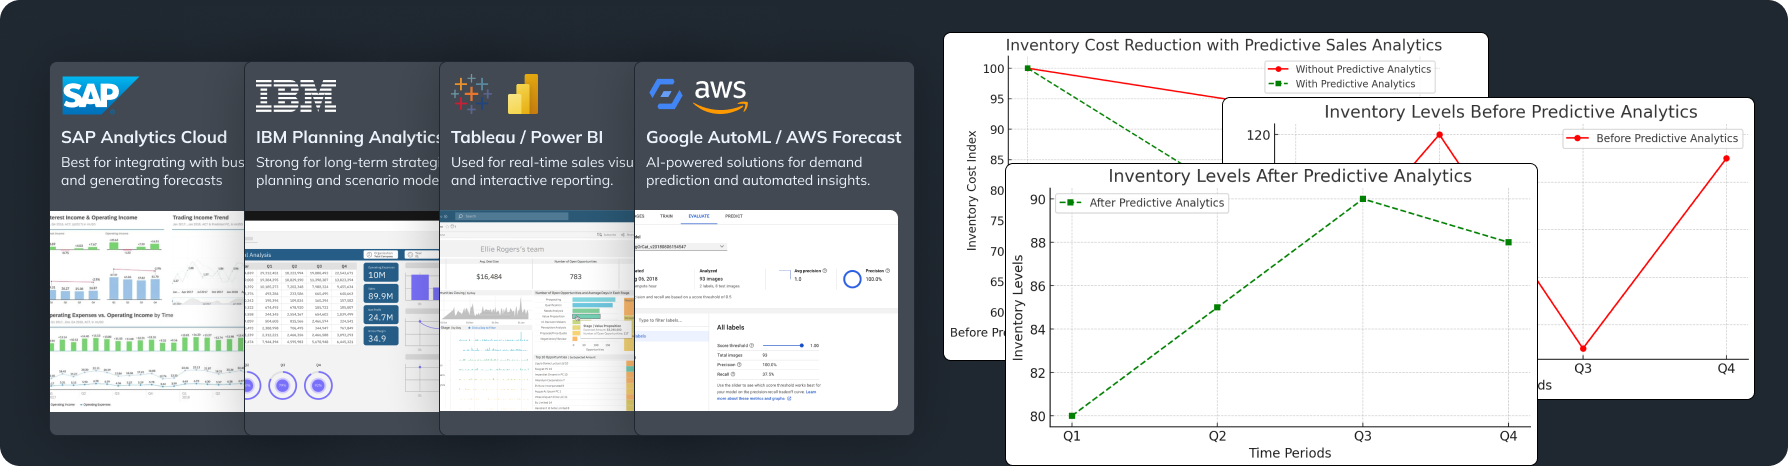
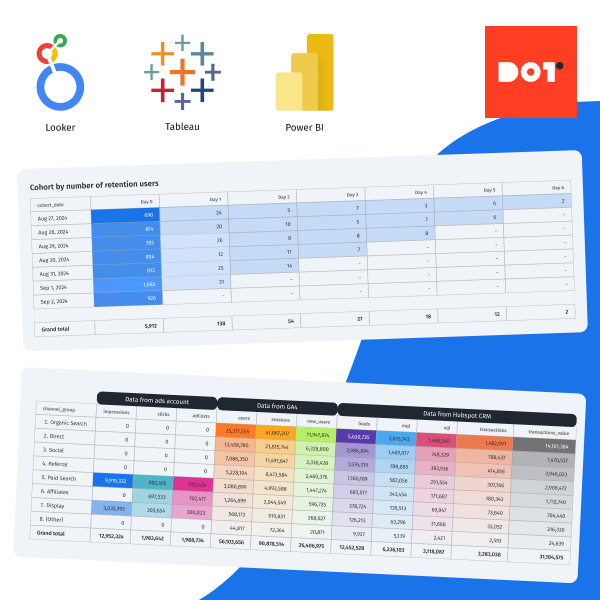
- Tableau or Power BI: Use these platforms to create interactive dashboards showing real-time data. You can combine multiple sources into one visual, making it easier to share with stakeholders. This strategy can illuminate key product analytics examples in presentations.
- Looker Studio: A budget-friendly option, Looker (Google Data) Studio allows you to create tailored reports connected to your Google Analytics data for constant performance updates.
Common Mistakes in Data Interpretation and How to Circumvent Them
Avoid these common mistakes when interpreting data:
- Overlooking Context:
Always give context to insights. For example, an increase in user traffic during holidays needs to be seen with average traffic data for a complete understanding. - Ignoring Outliers:
Outliers can give important insights. Don’t dismiss them; investigate to understand their causes. If a feature suddenly has high engagement, find out why, a vital point often reinforced in product analytics examples.
Driving Decision-Making with Product Analytics
Incorporating Analytics into Your Product Development Lifecycle
Use insights from product analytics throughout your whole development process:
- Use analytics to check ideas before starting development. Look at user feedback to see if there’s interest in a new feature.
- Track key metrics during different development stages to understand the impact of changes. Use what you learn to guide your next steps, applying effective product analytics examples where applicable.
Engaging Stakeholders and Making Data Accessible for Decision Making
Create visual reports that summarize data. This helps stakeholders understand key points quickly, regardless of their analytical skills. Structure reports to address specific questions for practical applications such as demonstrating product analytics examples.
A Systematic Approach to Ensuring Analytics Inform Product Strategy
Make sure analytics are shared across all teams:
- Create Regular Updates:
Regularly share key metrics and how they connect to business goals. Keep everyone informed so that data drives decisions. - Include All Departments:
Share product data with every team—sales, marketing, and customer support can use insights to boost their strategies. They can also incorporate product analytics examples to show impact.
This shared understanding strengthens your ability to create effective product strategies.
New Topic: Additional Resources and Education
Continuing Education and Development
Online Courses: Platforms like Coursera and Udacity offer detailed courses on product analytics, from beginner to advanced levels, which can include analysis of product analytics examples in practice.
Guides and eBooks: Look for comprehensive guides made by well-known analytics platforms. They often explain best practices and new trends in product analytics.
Staying educated helps you keep up with industry changes and new strategies in analytics.
Summary
Using product analytics effectively is essential for improving products and increasing user satisfaction. We looked at different methods, highlighting the need to combine qualitative and quantitative data, the importance of defining KPIs that align with business goals and using specialized tools for detailed analysis. Remember to examine product analytics examples as you assess and refine your strategies.
Regular analysis of product metrics, while following best practices in visualization and interpretation, is vital to becoming data-driven in product management. Remember, leveraging actionable insights helps you make smart decisions and transforms your approach to developing products.
If you have questions, reach out to a Dot Analytics expert for a free 20-minute consultation to get answers. Working together, you can turn insights into meaningful actions, keeping your product competitive and focused on users.


Leave a Reply