

What is data analytics reporting
Data analytics reporting creation is the process of generating reports that allow businesses to quickly gain valuable insights. For example, in the past, marketers had to manually download data from advertising platforms, combine it with sales or lead information, perform calculations, and only then present the results to management or make decisions based on this data. This is a very time-consuming process that requires a significant amount of time from specialists and increases the risk of errors.
Data analytics and reporting help marketers, product owners, and analysts to organize vast amounts of information and focus on what really matters to the business. By utilizing business intelligence insights and dashboard creation tools, you can streamline the reporting process, making it more efficient and less prone to errors. This article will show you how to optimize the reporting process so you can create effective reports.
Why is this important?
There have been cases where PPC specialists manually downloaded data from Google Analytics, Google Ads, Meta Ads, and CRM systems, then combined it in Excel or Google Sheets. This could take up to 12 hours of work time. However, automating the reporting process not only frees up time to focus on key tasks but also ensures the stability and quality of the reports. A specialist may fall ill, go on vacation, or leave the company, which makes manual reporting extremely vulnerable. By leveraging dashboard creation tools and business intelligence insights, automated systems solve these problems by providing a continuous and efficient data analysis process.
The Importance of Data Analytics Reporting
The importance of data analytics reporting for businesses cannot be overstated. Clear and accessible reports significantly simplify decision-making processes, allow businesses to identify growth areas, detect issues in processes or products, and adjust strategies for positioning goods or services. By utilizing effective data visualization techniques and advanced reporting software solutions, businesses can ensure that their reports are not only comprehensive but also easy to understand.
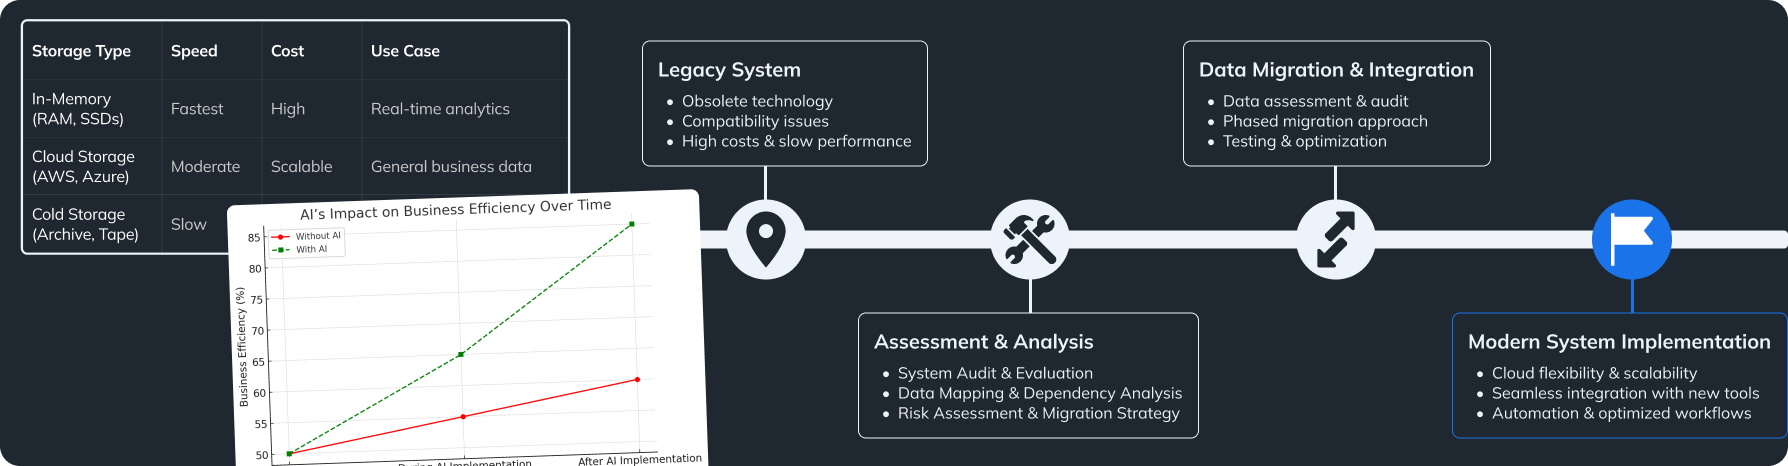
For instance, a retail company had a standard website and a mobile app where customers could make purchases and interact through marketing tools, building customer profiles. However, the company lacked a clear understanding of what exactly was happening within the app. Unlike the website, the app posed new challenges in tracking user behavior and improving the customer journey. The problem was that tracking methods in a web environment and a mobile app were fundamentally different.
The company had a solid grasp of what was happening on the website, using data analytics reporting to optimize advertising campaigns and manage inventory. However, they didn’t have the same level of understanding when it came to the mobile app.
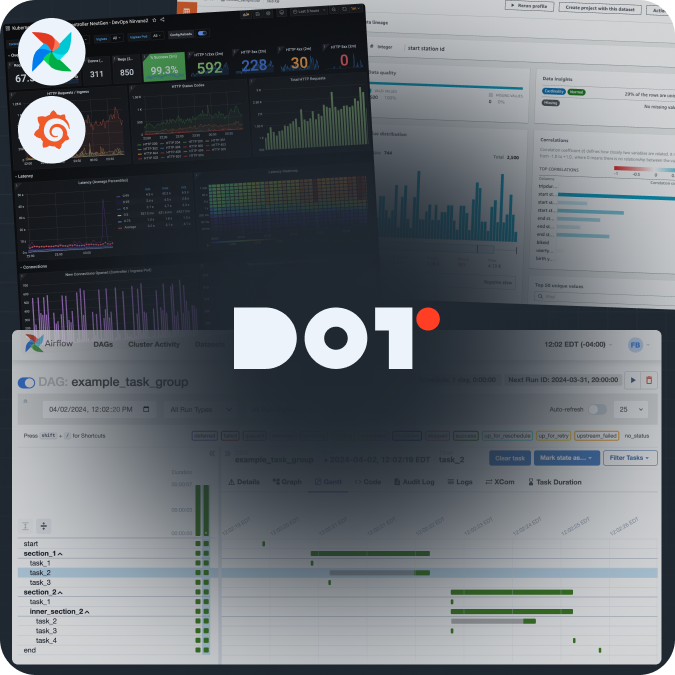
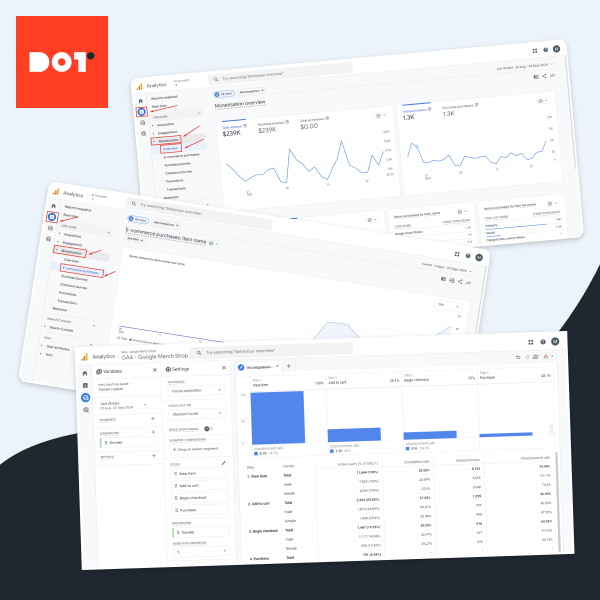
Interactive reporting, which combined sales data with CRM systems, analytics tools like Adjust, Firebase, Crashlytics, and advertising platforms, allowed for in-depth analysis of the app’s impact on sales. Thanks to interactive dashboards that utilized real-time information on installations, sales, and user activity, along with powerful reporting software solutions, the company was able to discover new ways to engage users and enhance their experience within the app using innovative data visualization techniques.
Essential Steps for Effective Data Analytics Reporting
Key Steps for Effective Data Analytics Reporting
Step 1: Define goals and objectives.
First and foremost, it’s important to clearly understand what you aim to achieve with your dashboards. For example, if your goal is to improve PPC advertising, SEO, or lead generation, you should develop a visualization that highlights which channels perform better and provide the highest return on investment for every dollar spent. Using the right data analytics reporting tools can help you visualize these insights effectively.
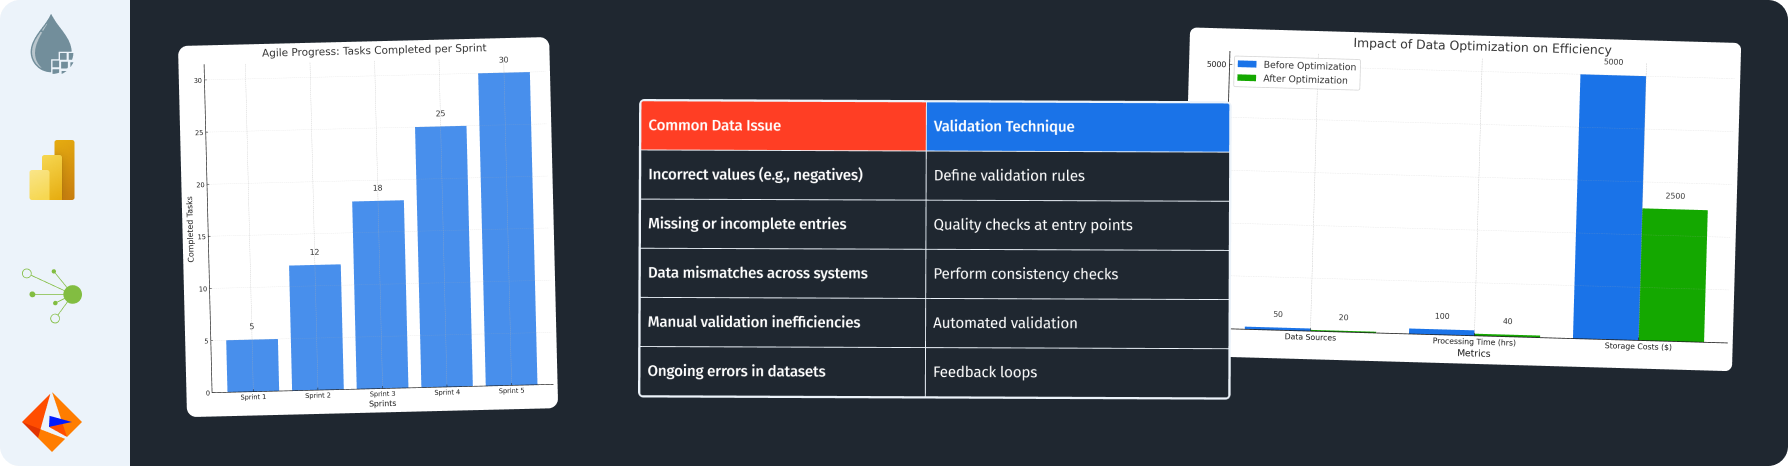
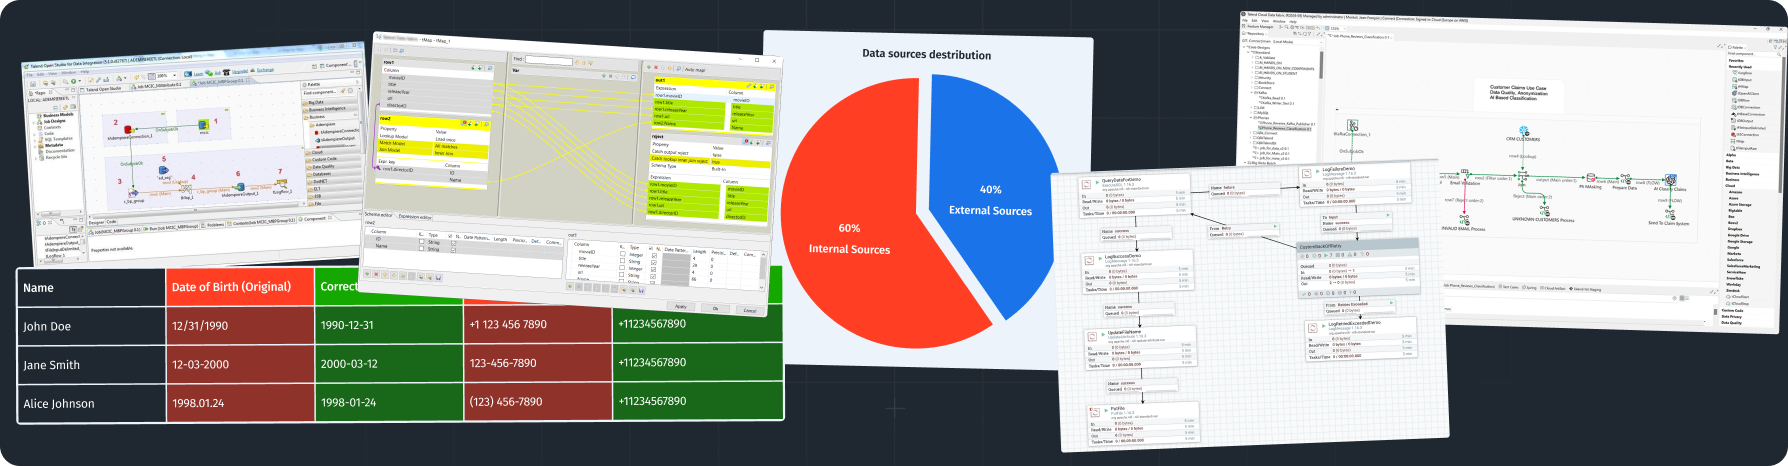
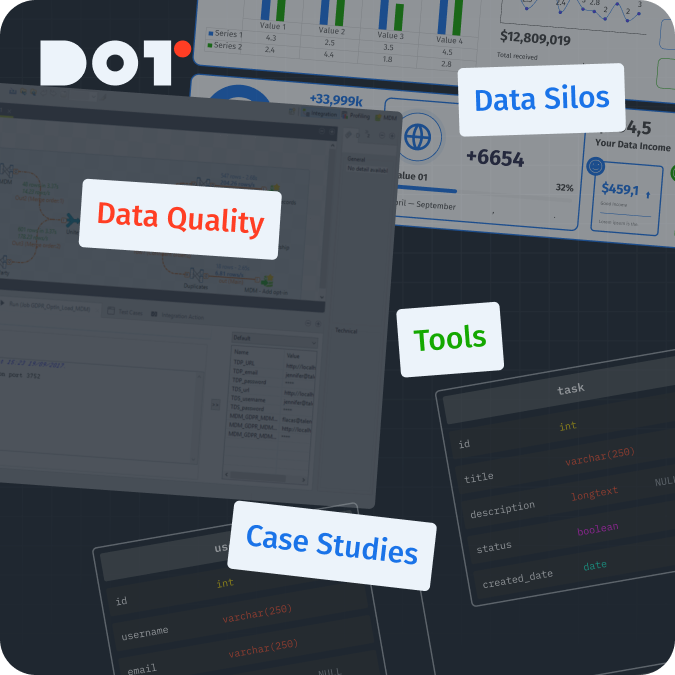
Step 2: Data collection and validation.
Without high-quality data, it’s impossible to generate accurate insights. It’s essential to ensure the data is accurate and up-to-date. For example, check the data for duplicates or missing values, incorrect symbols that complicate data usage, and misleading entries. Clean and accurate data is vital for analytical decision-making, enabling you to draw actionable insights.
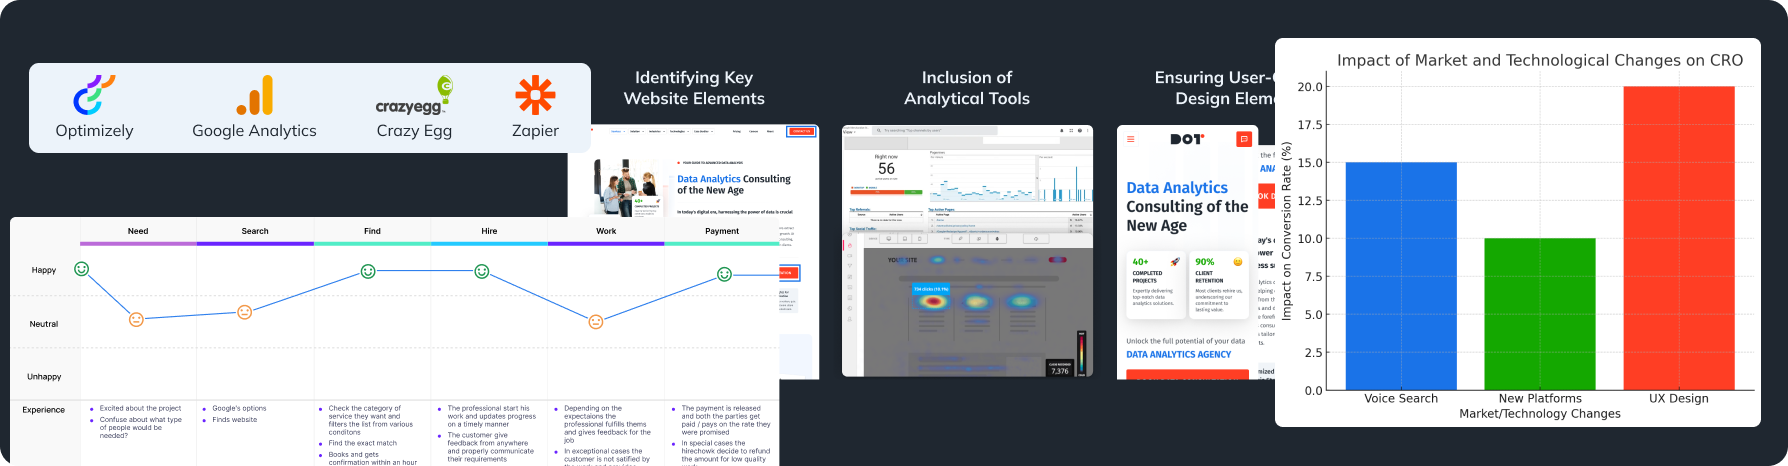
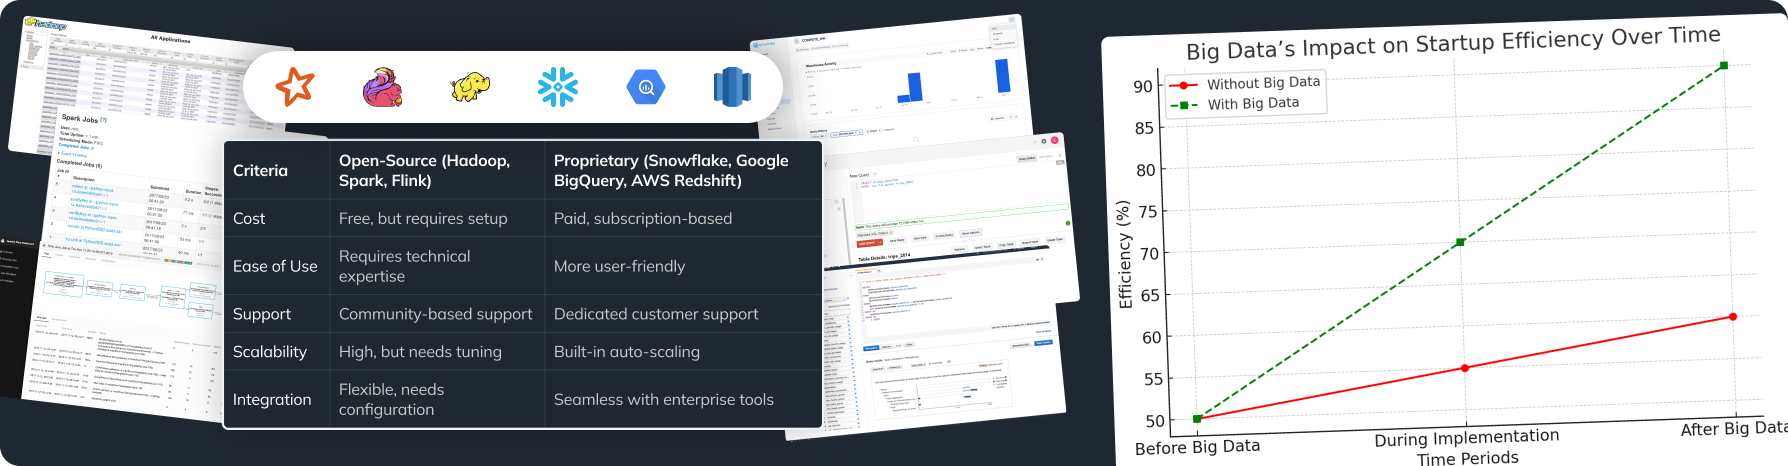
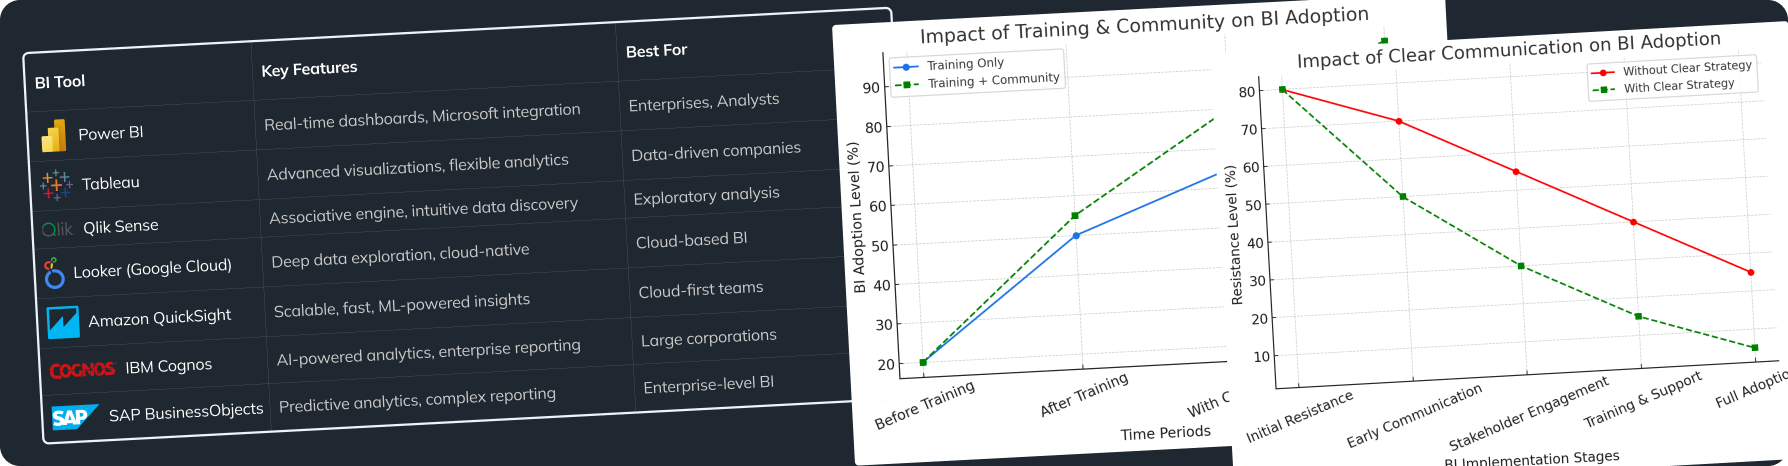
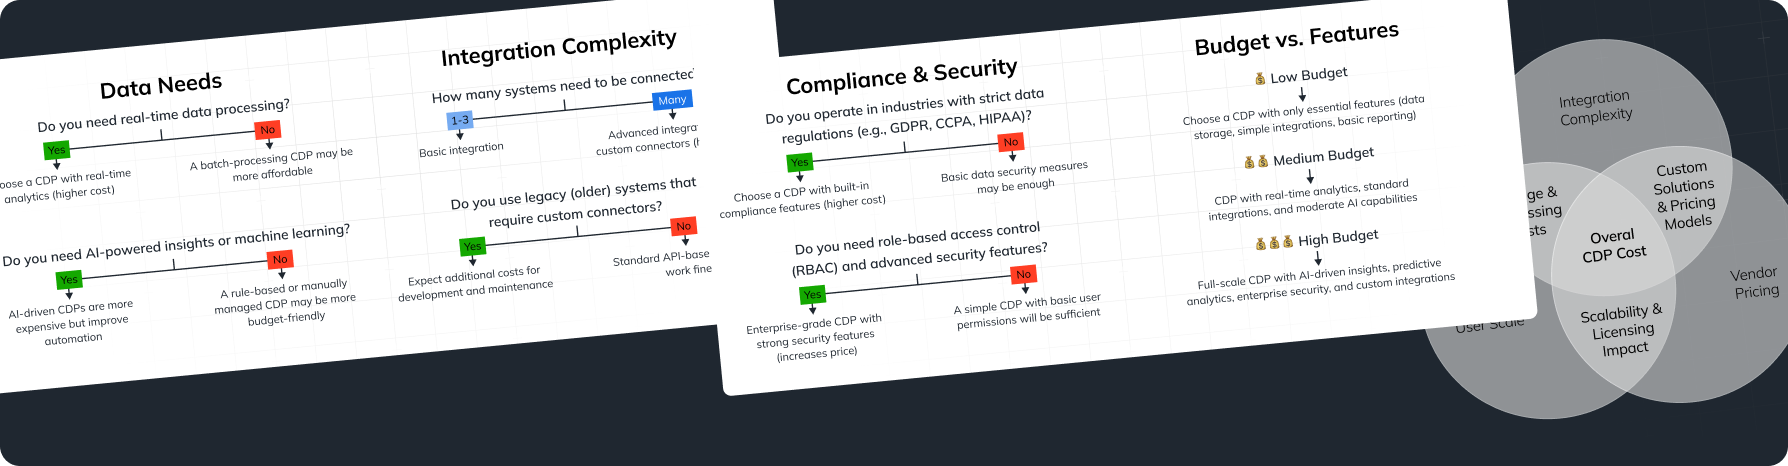
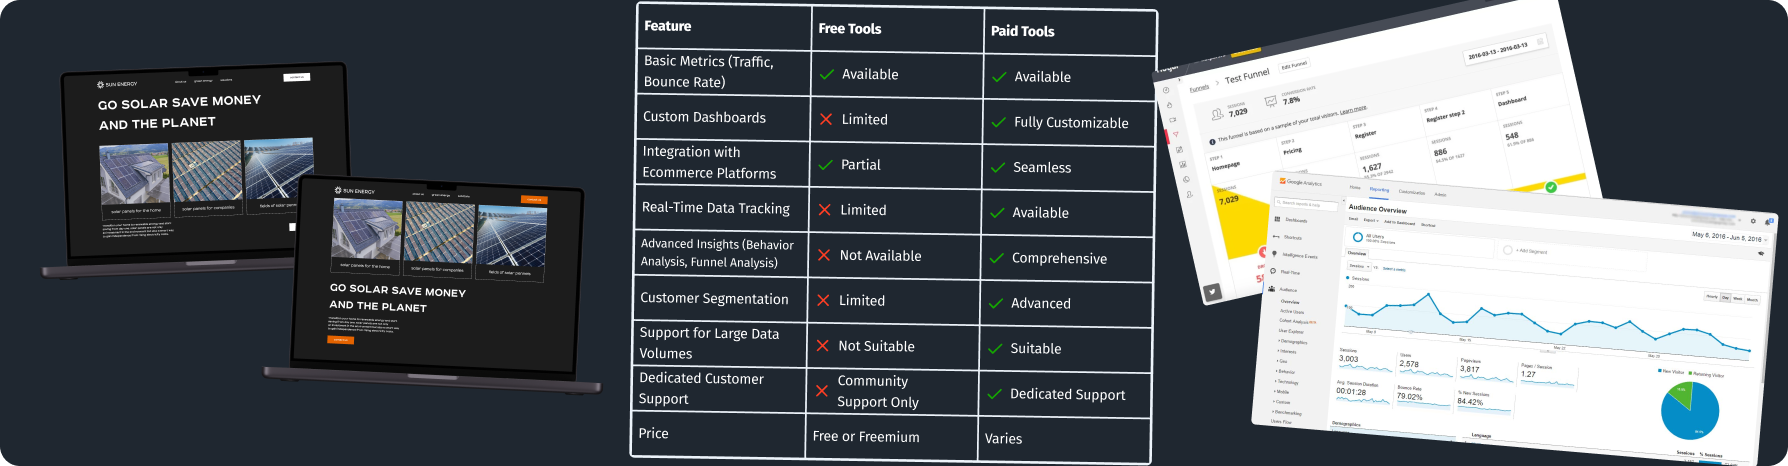
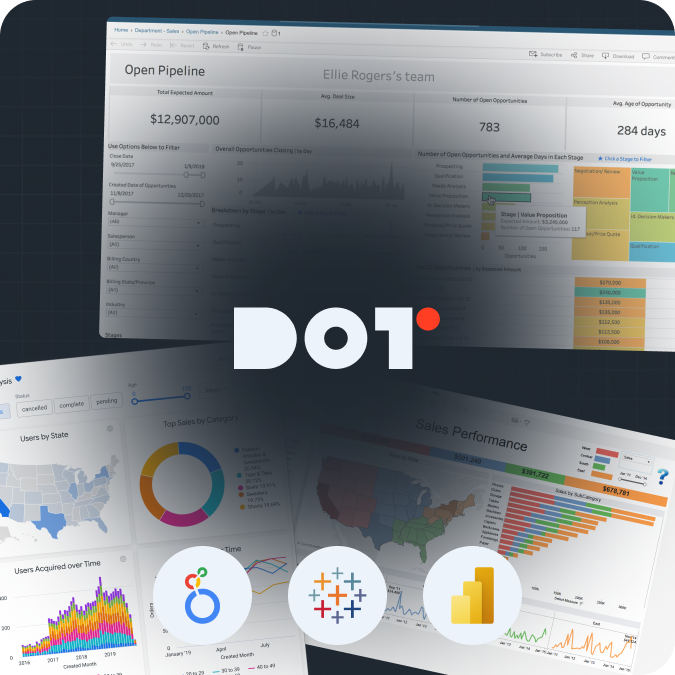
Step 3: Choose the right tools and software.
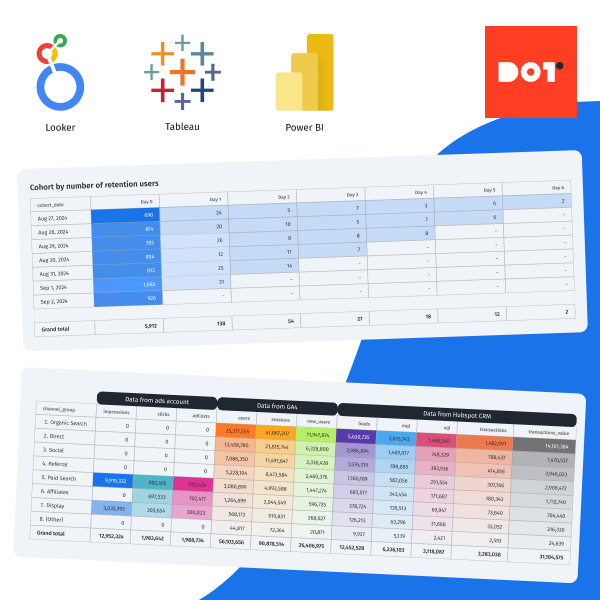
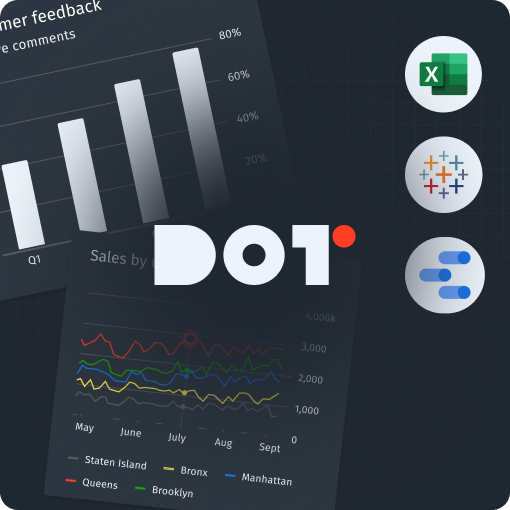
Today, there are many data analytics reporting tools available, such as Tableau, Power BI, and Google Data Studio. The choice of tool depends on your needs and technical capabilities. For example, if you need a tool for interactive data visualization, Power BI could be a great choice, while Google Data Studio is well-suited for integration with other Google products. Choosing the right tool ensures that your reporting supports analytical decision-making effectively.
Step 4: Data Analysis Techniques
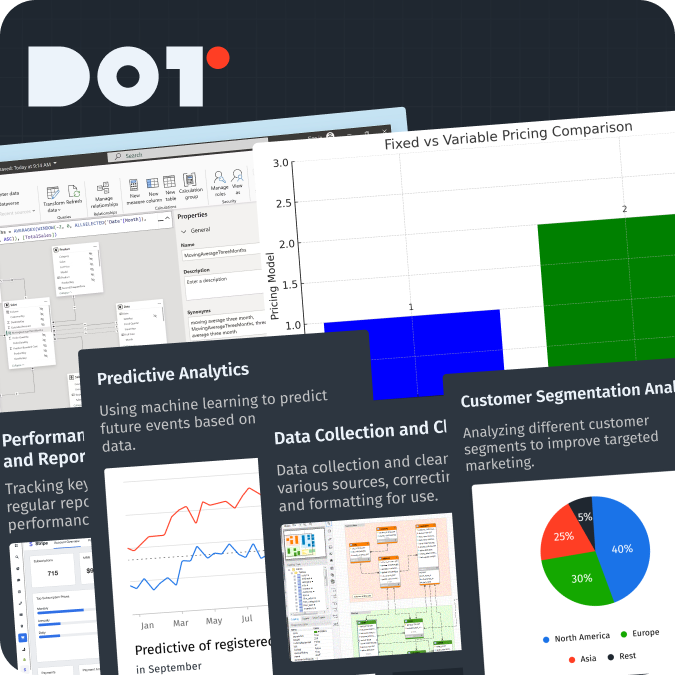
There are a few key techniques that data analysts rely on. The first is descriptive analysis, where we use statistics or visualizations like graphs and tables to see what’s happening in the data—giving us a clear view of key trends and any anomalies. Next is diagnostic analysis, which digs deeper to uncover the reasons behind those trends or issues. After that comes predictive analysis, where we use models to forecast future events based on historical data. Choosing the right data collection methods is also crucial for accurate and insightful analysis, ensuring your data reporting and analytics efforts are reliable and actionable.
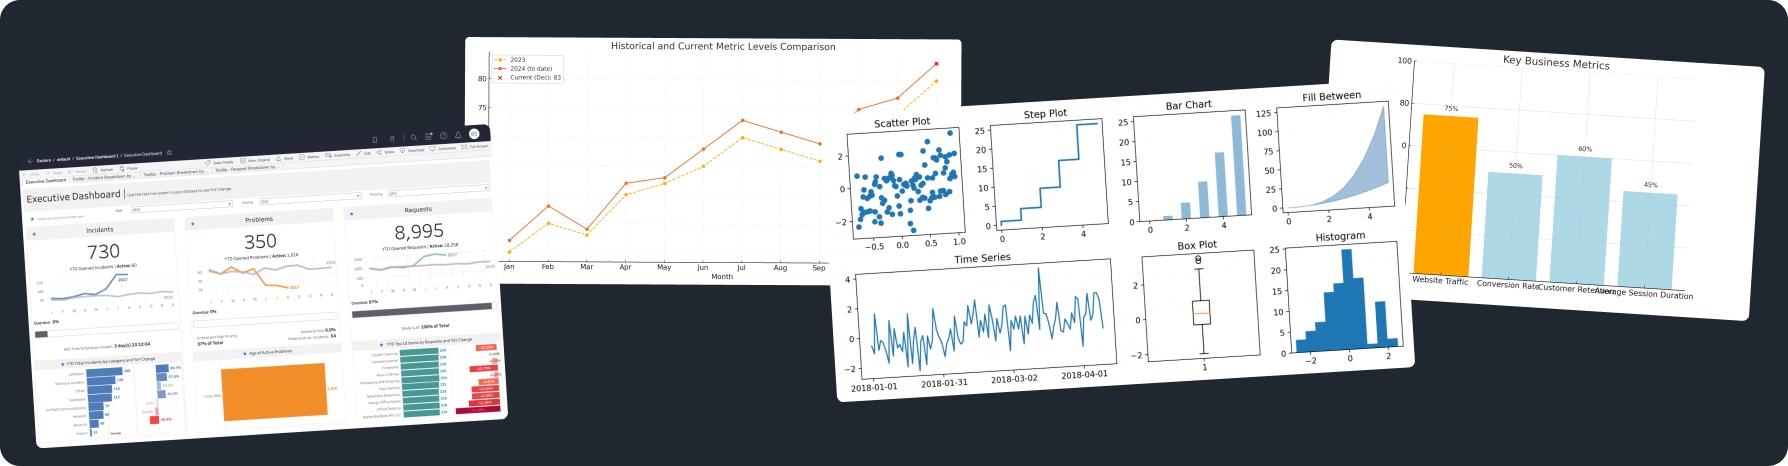
Step 5: Visualization and Presentation
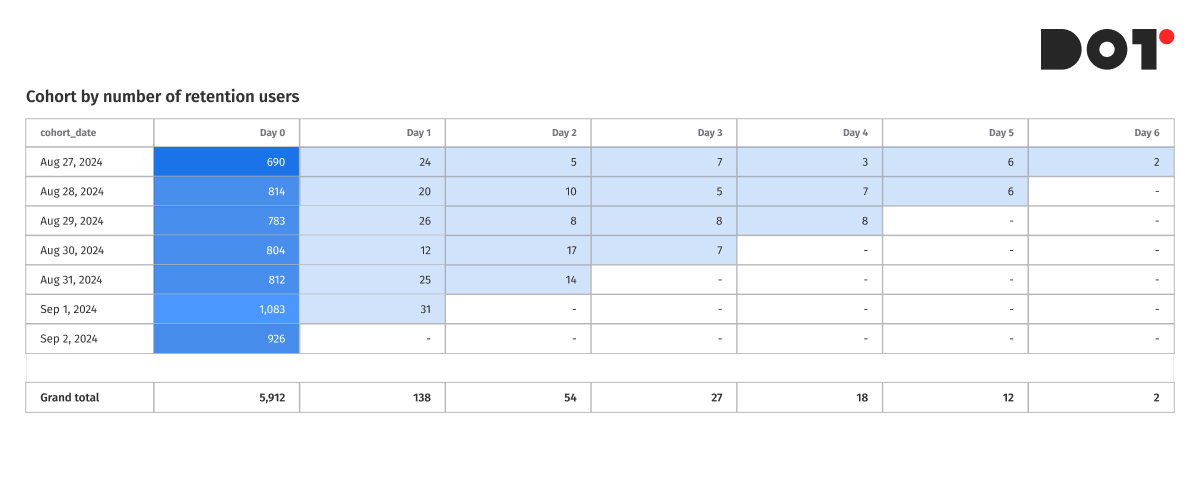
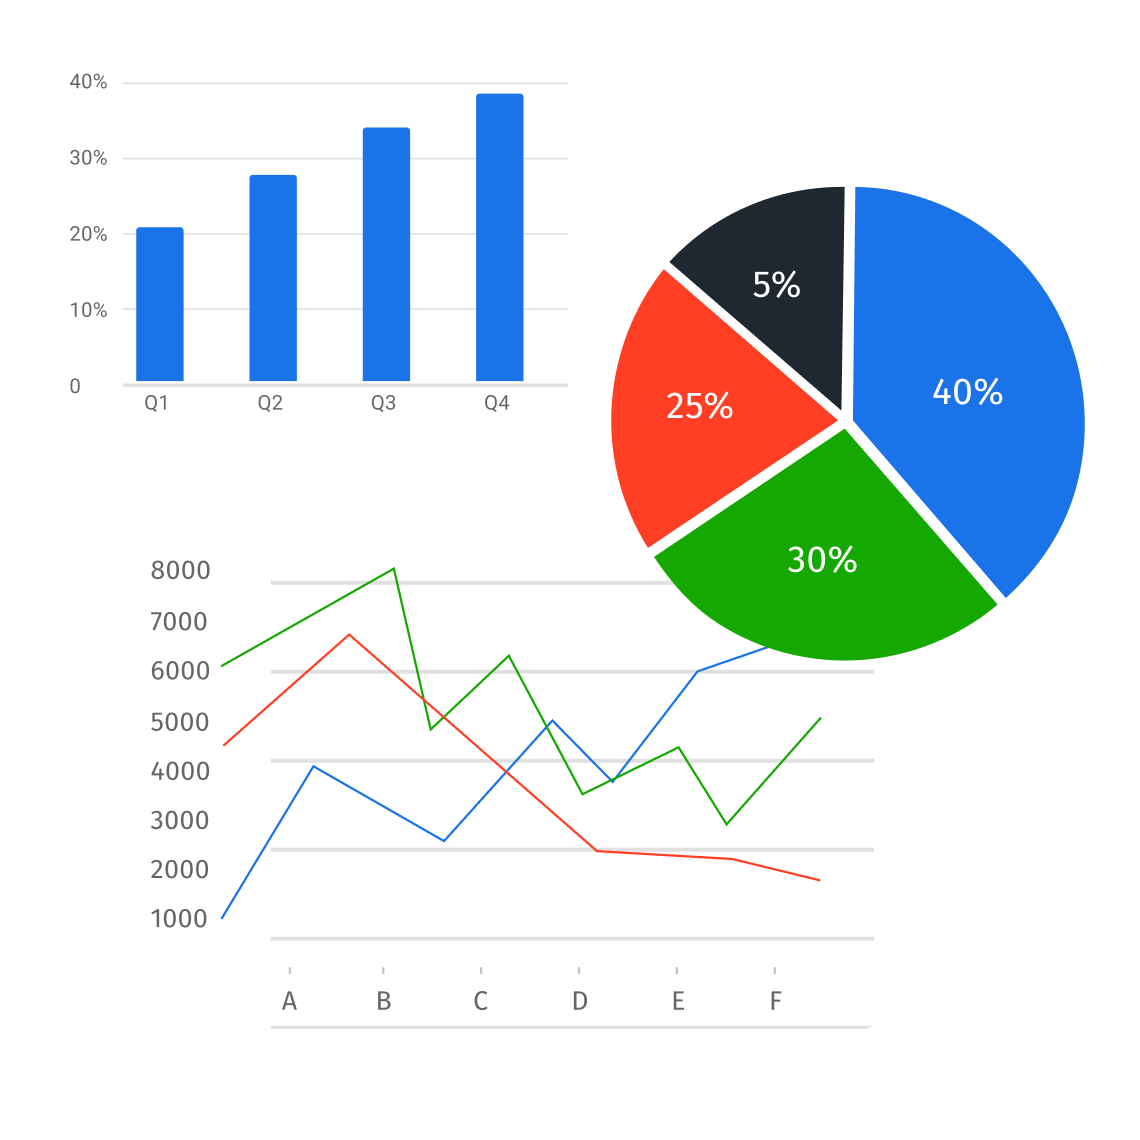
Good data visualization is what turns reports into clear and actionable insights. If you’re tracking trends over time, line charts are ideal for visualizing those changes. For comparing categories, bar charts make it easy to spot which one stands out. When analyzing historical data, especially user behavior or purchases, cohort analysis built using pivot tables can reveal valuable patterns. For detailed product assortment analysis, tables are essential since they offer in-depth data for each item. Using the right data analytics reporting tools not only enhances clarity but also ensures that your data reporting and analytics are precise and effective.
Step 6: Turning Data into a Story
One of the key aspects of reporting in data analytics is transforming dry numbers and facts into a compelling and understandable narrative. This isn’t just about analyzing data—it’s about showing the causes and effects so report users can see the bigger picture behind the numbers. Start with a problem or question, use the data to explore it, and then conclude with recommendations or findings. This approach is particularly important when working with predictive analytics models or explaining key performance indicators (KPIs) to stakeholders.
Step 7: Review and Refinement
Reports should have version control to ensure accuracy and relevance. Once a report is created, it’s important to review it and gather feedback. For instance, we use DBT and GitHub for building reports, allowing us to track changes and refine the report to address more questions and improve accuracy. This process is crucial when using statistical analysis software to identify and correct potential issues, ensuring the report is more reliable and informative.
Step 8: Implement Feedback and Update Regularly
Feedback is essential for improving your reports, but it’s equally important to keep them updated as new data or changes in the business emerge. If your company starts using a new marketing channel, for example, you need to incorporate that data into future reports to ensure your key performance indicators (KPIs) stay relevant. Likewise, regularly update your reports to reflect any new insights from predictive analytics models to keep them aligned with current business goals.
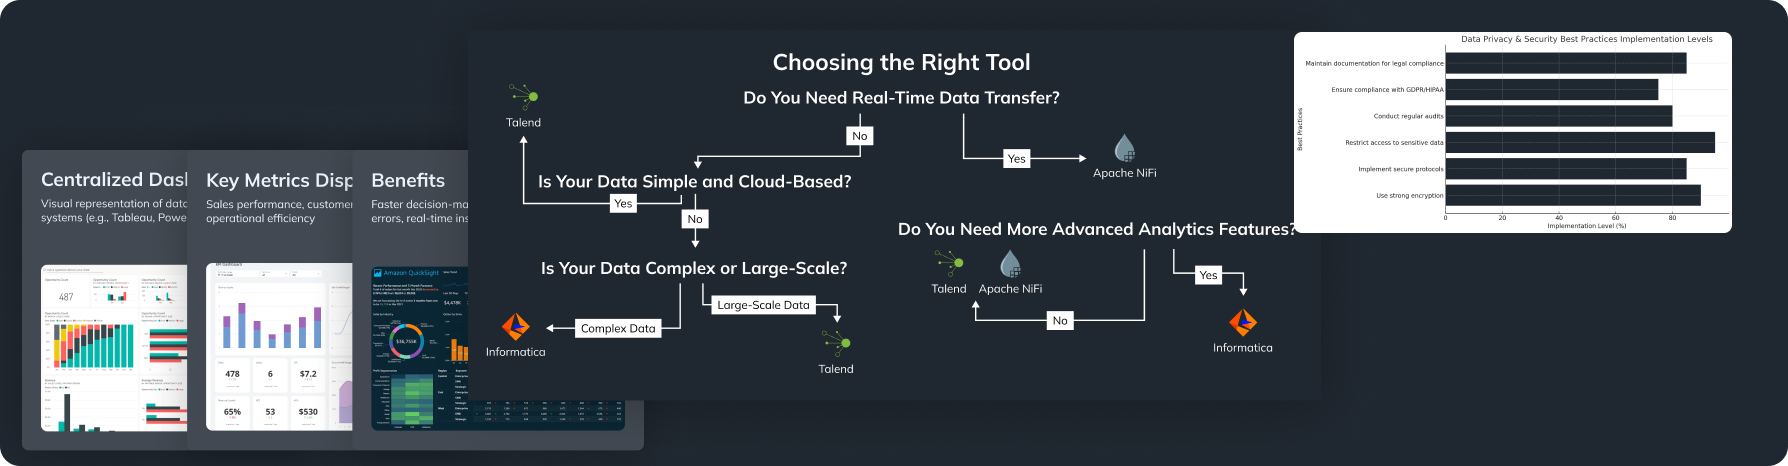
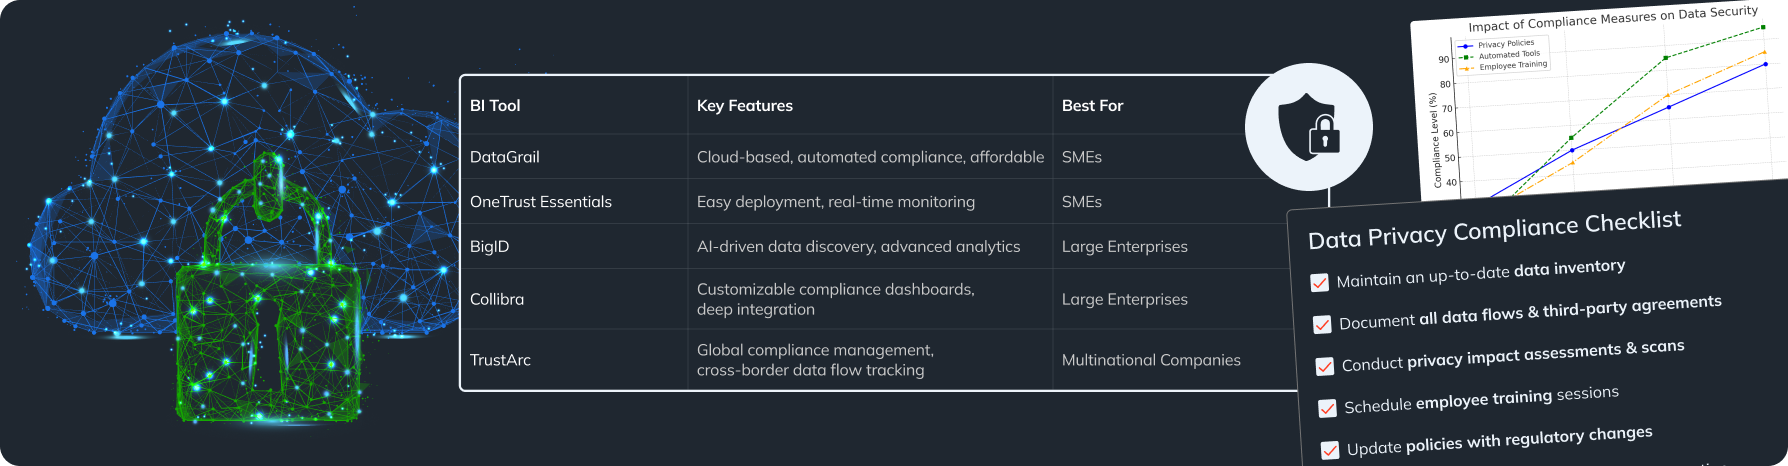
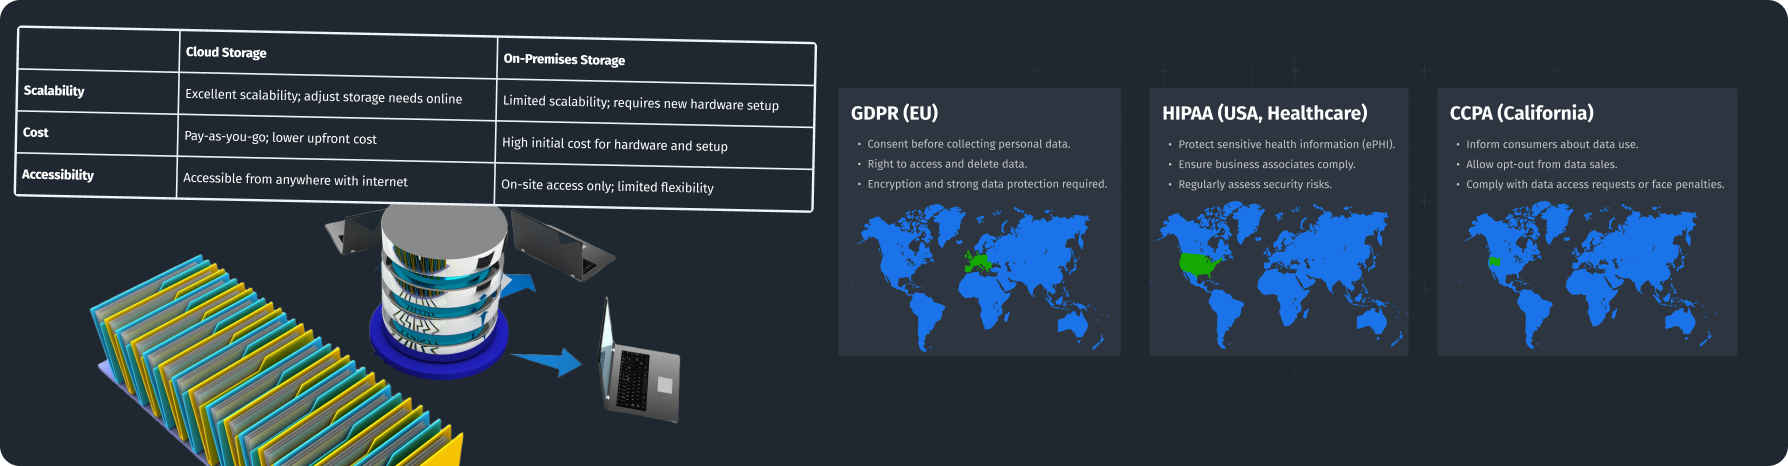
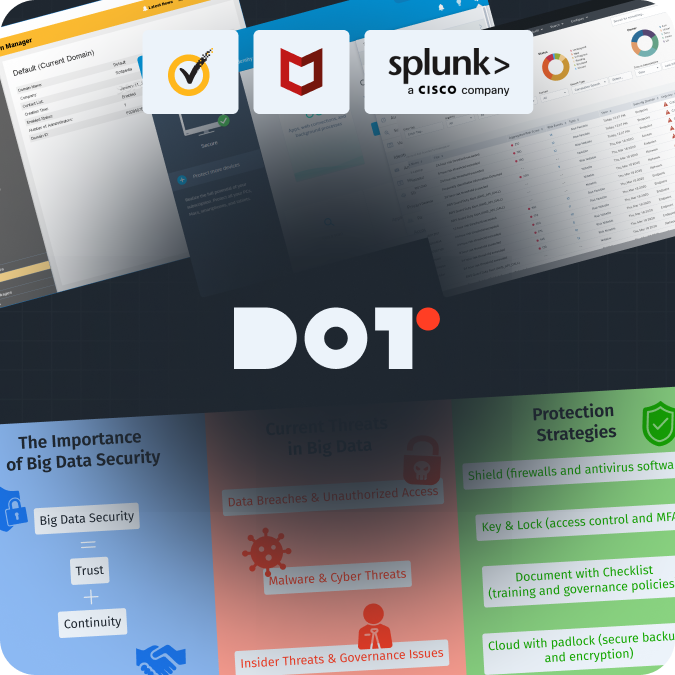
Step 9: Security and Distribution
Don’t forget to secure your reports. Use encryption and limit access to confidential data. For distributing reports, ensure you’re using secure platforms like Tableau, Looker, or Power BI to safely share insights with the right stakeholders. Secure distribution is critical in maintaining the integrity of reporting in data analytics.
Advanced Tips and Tricks
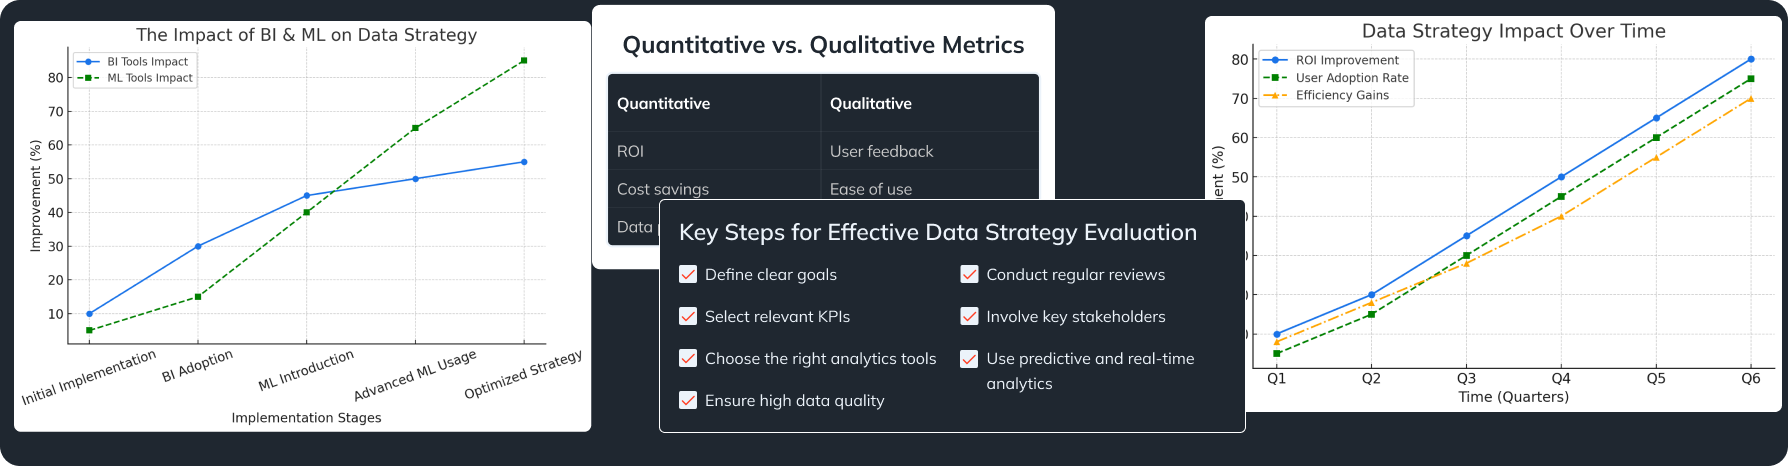
Artificial Intelligence and Machine Learning in Reporting
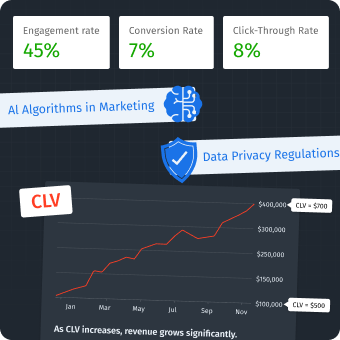
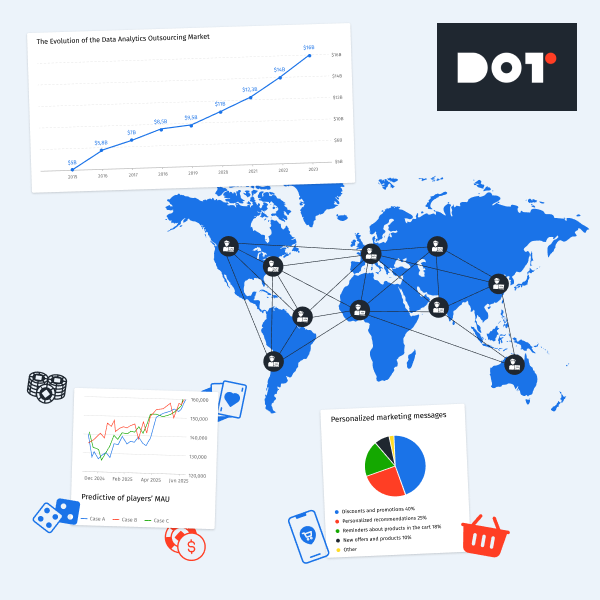
Artificial intelligence (AI) and machine learning (ML) can automate reporting processes and significantly improve their accuracy and efficiency. Instead of manually analyzing large datasets, you can leverage Python libraries such as TensorFlow or Scikit-learn to automatically detect key trends, anomalies, and correlations in your data. Additionally, using platforms like BigQuery ML allows you to perform real-time analysis at scale, processing massive amounts of data with speed and precision. This is particularly beneficial when working with dynamic datasets, such as real-time customer behavior or marketing performance data.
Several common ML models can be applied in real business scenarios:
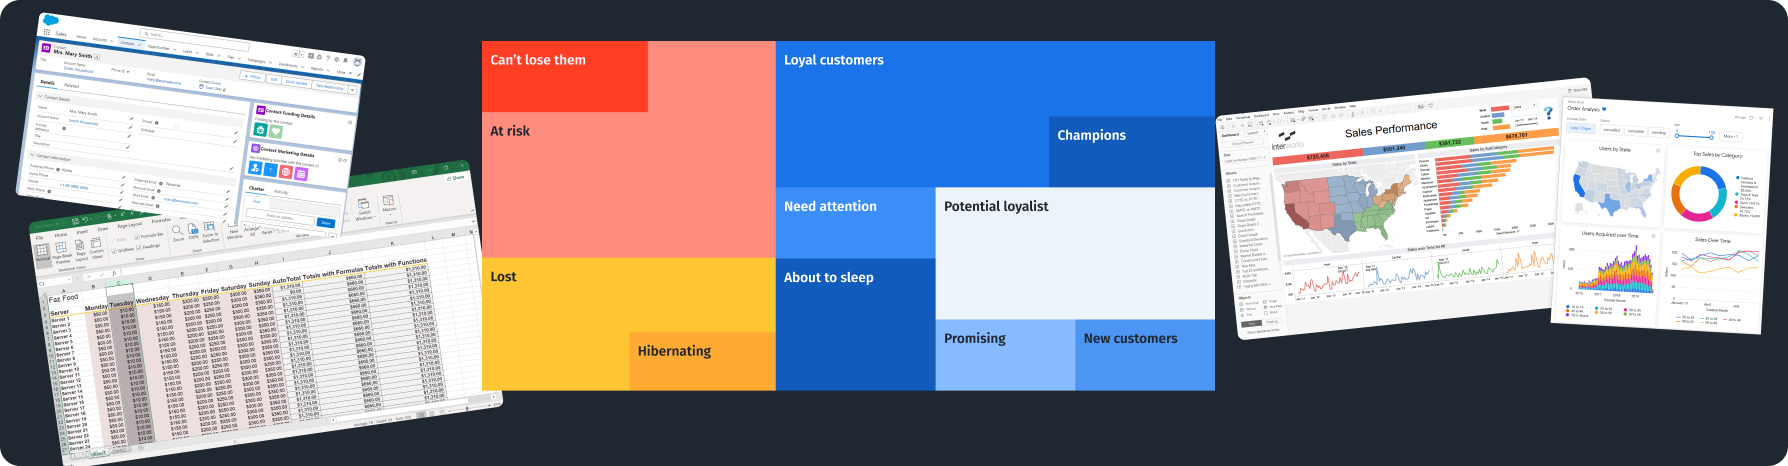
- K-Means Clustering – Used for customer segmentation by grouping customers with similar behaviors. This helps marketers create personalized campaigns for each segment.
- Logistic Regression – Useful for predicting customer churn, helping businesses identify which customers are at risk of leaving, allowing timely intervention.
- Collaborative Filtering – This model powers recommendation engines, suggesting products or services based on customer preferences and behaviors, enhancing personalization.
- Time Series Forecasting (ARIMA, Prophet) – Ideal for sales forecasting and predicting seasonal trends, enabling more accurate planning and inventory management.
- XGBoost – A popular algorithm for predicting ad performance, allowing marketers to optimize campaigns by predicting which ads will result in conversions or high engagement.
Machine learning can also assist in predictive analytics, offering actionable insights by forecasting future trends based on historical patterns. For instance, if you’re a marketer aiming to predict which campaigns will deliver the highest ROI next month, ML algorithms can analyze prior performance, consumer behavior, and external factors to generate accurate predictions. This helps optimize your marketing strategy, ensuring you allocate budgets effectively and maximize returns. Moreover, ML models can continuously learn from new data, making future predictions even more precise over time.
By integrating AI and ML into your reporting processes, you not only save time but also gain deeper insights that would be difficult to uncover through traditional methods. This makes data-driven decision-making more reliable and scalable, helping businesses stay ahead of the competition
Common Pitfalls in Data Analytics Reporting and How to Avoid Them
Data Analytics Reporting can be challenging, and even experienced professionals sometimes make mistakes.
- Incorrect or incomplete data: One of the most common issues is using data that contains errors, duplicates, or missing values. This can lead to incorrect conclusions and decisions.
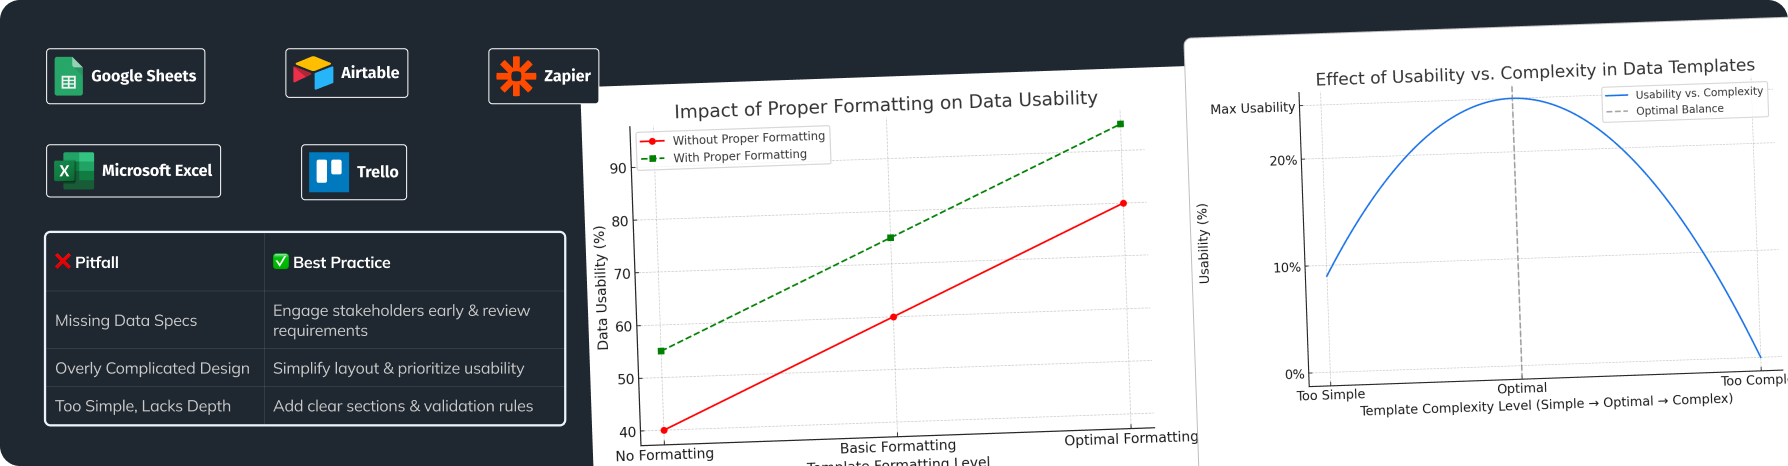
- Misalignment of reports with business goals: Reports often do not align with the actual needs of the business, either including too much information or being too complex to understand.
- Poor data visualization: Using complex charts or overloaded diagrams can make reports difficult to comprehend. Choose simple and clear visual elements to effectively convey key insights.
Best Practices
- Data validation: Ensure that the data is accurate and complete before starting the analysis.
- Clear objectives: Define specific questions that the report should address.
- Simple visualizations: Select charts that are easy to understand and that clearly reflect the main insights.
- Feedback: Gather feedback from report users and improve them accordingly.
- Continuous updates: Regularly update reports to reflect new data and changes in the business
Case Studies and Success Stories
Example of One of Our Clients – A Marketing Campaign in the E-Commerce Sector
Company and Product:
One of the leading players in the e-commerce sector, specializing in the sale of household appliances and electronics, faced the challenge of optimizing their advertising campaigns. The company offered a wide range of products, from smartphones to kitchen appliances, and spent significant resources on advertising across various channels. However, they lacked a clear understanding of which of these channels actually generated the most revenue.
Challenges:
Before implementing the new reporting system, the company relied on fragmented data from separate ad accounts, making it difficult to assess the true effectiveness of their campaigns. The lack of integration with the CRM system prevented them from accurately tracking the real ROAS and linking advertising costs to actual sales. Additionally, there was no data quality assurance in place, which led to unreliable insights and hindered effective decision-making.
Solution:
To address these challenges, the company, with our assistance, decided to implement a new reporting system using cloud-based reporting platforms. This system included the development and implementation of the following reports:
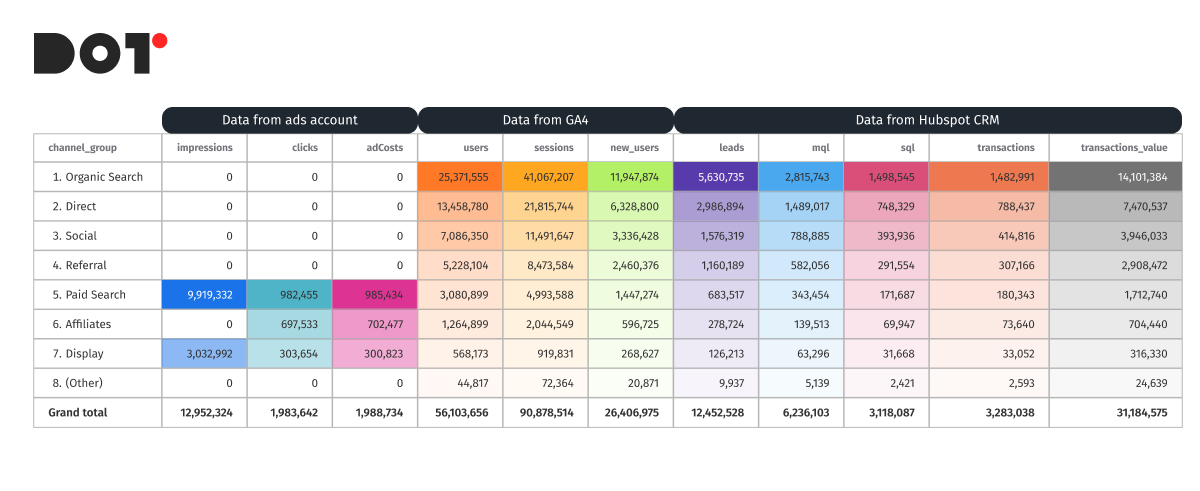
- Main KPI Report: This report enabled the integration of data from various ad accounts and the CRM system, allowing the company to see the full picture of their advertising campaign performance. With improved data quality assurance, they could calculate the true ROAS by taking into account all costs and revenues associated with advertising activities. This allowed them to make more informed decisions and enhance their overall business analytics strategies.
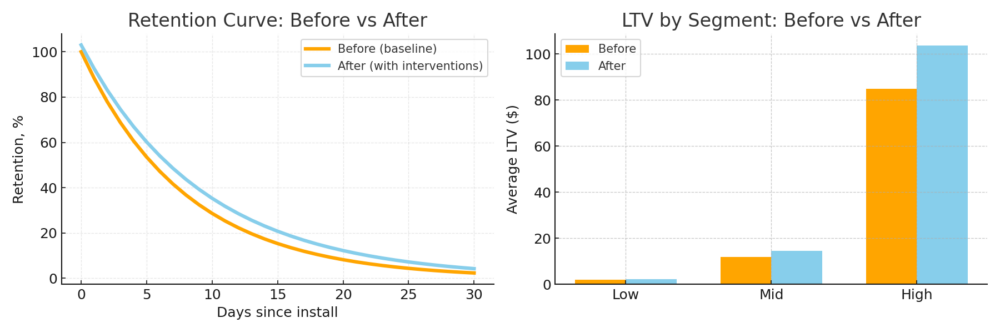
A significant portion of the profit growth was directly related to this report, as it enabled the company to adjust campaigns based on the actual effectiveness of each. The client realized that many of their Meta Ads campaigns did not have a sufficient ROAS, whereas it became clear that they needed to increase the budget for Google Ads PMax campaigns. Additionally, the Apple Search and UAC campaigns showed a good LTV, making it profitable to invest in acquiring new app users. - RFM Model for Email Marketing: The use of an automatic RFM model (Recency, Frequency, Monetary) allowed the company to better engage with their audience by segmenting customers based on their behavior. This enabled the setup of personalized email campaigns, improving their effectiveness and increasing repeat purchases.
- Cohort Analysis of Traffic Quality: Cohort reports gave the company the ability to evaluate the quality of traffic by tracking the behavior of users who interacted with their website during different time periods. This helped them understand which campaigns were bringing in more loyal customers who made repeat purchases.
- MCF Report (Multi-Channel Funnels): This report helped the company track the customer journey to purchase across various advertising channels, including the length of the contact chain with ads. They were able to understand which combinations of channels worked best and how to optimize the sequence of actions for maximum impact.
Results:
Thanks to the implementation of the new reporting system using cloud-based reporting platforms, the company significantly improved the effectiveness of their advertising campaigns. They discovered that ads on one platform, particularly Instagram, generated the highest conversion rates. This allowed them to reallocate their advertising budget, leading to a 25% increase in profits in just a few weeks.
Additionally, audience segmentation using the RFM model improved the effectiveness of email marketing, while cohort analysis and MCF reports provided deeper insights into traffic quality and channel performance. As a result, the company was able to reduce spending on less effective channels and increase overall return on investment (ROI). The incorporation of data quality assurance measures also ensured that all future insights were reliable and actionable, supporting their long-term business analytics strategies.
Conclusion and Next Steps
Mastering data analytics reporting is essential for any company looking to optimize marketing efforts and boost profitability. Key steps like setting clear goals, gathering and validating data, choosing the right tools, analyzing and visualizing insights, and constantly improving reports can turn your data into a powerful decision-making tool. By implementing automated reporting models and real-time data analysis, businesses can uncover deeper insights and react to changes faster.
Now that you’re familiar with these strategies, it’s time to put them into practice. Adopting these methods will help your business cut costs, increase revenue, and drive consistent growth.If you need assistance setting up a robust reporting system or want to tap into our specialized data analytics services, feel free to reach out – dotanalytics.ai. Our experts are ready to help take your business to the next level with cutting-edge data solutions.


Leave a Reply